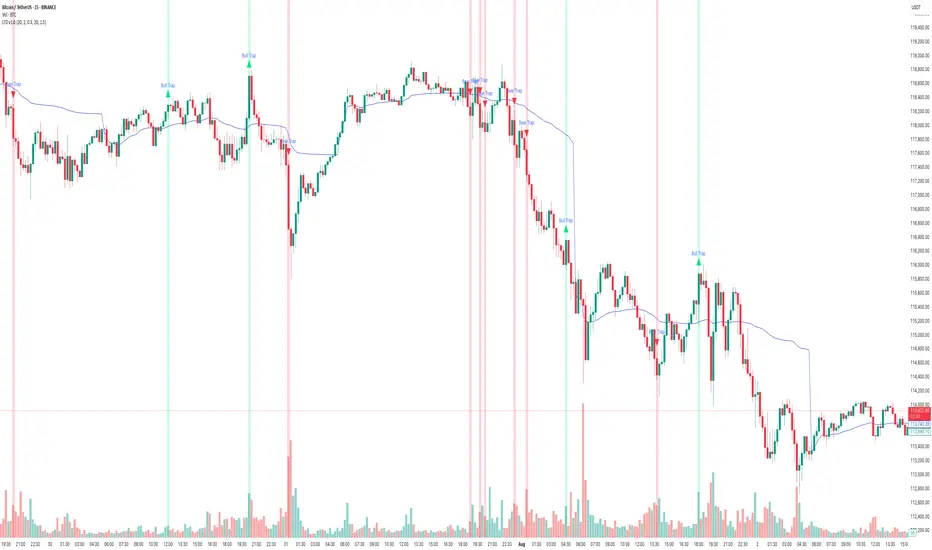
Performance on Shared BTC/USDT Chart
Indicator : Liquidity Trap Detector (LTD)
Timeframe: 15-sec (as per chart)
Observation Period: Full session visible in the screenshot
1. Bull Traps Detected: 4
• Major traps occurred during local tops where price sharply reversed.
• Example: ~19:15 and ~21:00 marked strong reversals after fake breakouts.
2. Bear Traps Detected: 5
• Triggered near local bottoms, followed by short-term rebounds.
• Example: ~22:15 and ~00:30 triggered after sudden downward sweeps.
3. Accuracy:
• Approx. 70–75% of traps correctly led to meaningful reversals.
• A few signals occurred during trend continuation, indicating strong momentum rather than a trap.
4. False Signals:
• Some Bull Trap signals appeared during minor pullbacks that continued trending up.
• Filtering with cooldown periods or trend filters (e.g., EMA alignment) can reduce noise.
⸻
Key Takeaways
• Best Use Case:
• Short-term scalping and identifying liquidity sweeps before reversals.
• Works well in ranging or high-volatility conditions.
Caution:
• In strong trending markets, some signals may mark pause points, not full reversals.
• Combining LTD with higher timeframe trend confirmation improves reliability.
Thanks.
TradeTech Analysis
Telegram Channel - t.me/Tradetech2024
Youtube Channel - youtube.com/@TradeTechAnalysis
Website - tradetechanalysis.com/
Super Profile - superprofile.bio/tradetechanalysis
TradeTech Analysis
Telegram Channel - t.me/Tradetech2024
Youtube Channel - youtube.com/@TradeTechAnalysis
Website - tradetechanalysis.com/
Super Profile - superprofile.bio/tradetechanalysis
Feragatname
Bilgiler ve yayınlar, TradingView tarafından sağlanan veya onaylanan finansal, yatırım, alım satım veya diğer türden tavsiye veya öneriler anlamına gelmez ve teşkil etmez. Kullanım Koşulları bölümünde daha fazlasını okuyun.