Bitcoin recently experienced a large downtrend, this is mainly because there was 'Competition' between it's relative, 'Bitcoin Cash' which saw prices of $2800 on some exchanges.
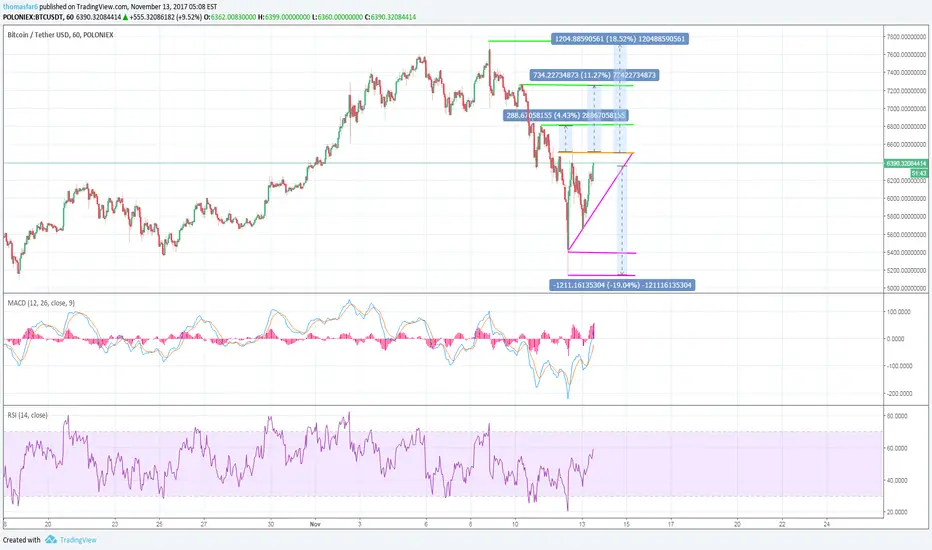
An ascending triangle pattern has formed which can indicate an upcoming bullish trend, the price is also trying to break the resistance price of $6,500 which you want to watch out for. If we break this we could see prices heading back up to $7,000, on the other hand, we may fall back to the support line on the triangle and if broken we could be plummeting even lower.
As always trade the lines accordingly.
An ascending triangle pattern has formed which can indicate an upcoming bullish trend, the price is also trying to break the resistance price of $6,500 which you want to watch out for. If we break this we could see prices heading back up to $7,000, on the other hand, we may fall back to the support line on the triangle and if broken we could be plummeting even lower.
- Orange - Resistance.
- Purple - Support.
As always trade the lines accordingly.
Feragatname
Bilgiler ve yayınlar, TradingView tarafından sağlanan veya onaylanan finansal, yatırım, işlem veya diğer türden tavsiye veya tavsiyeler anlamına gelmez ve teşkil etmez. Kullanım Şartları'nda daha fazlasını okuyun.
Feragatname
Bilgiler ve yayınlar, TradingView tarafından sağlanan veya onaylanan finansal, yatırım, işlem veya diğer türden tavsiye veya tavsiyeler anlamına gelmez ve teşkil etmez. Kullanım Şartları'nda daha fazlasını okuyun.