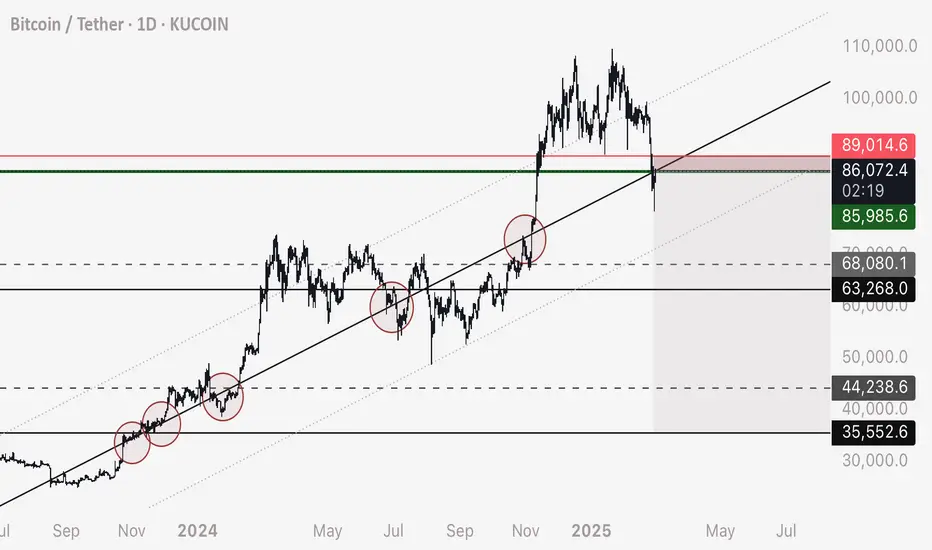
I’ve drawn the main trendline and marked the contact points in red circles if you’d like to replicate this on your own chart
I’ve also demonstrated that when the correct trendline is identified, it can be duplicated and placed at different points on the chart that price seems to follow - IE support / resistance works on a diagonal grid
I’ve marked my personal entry in green, stop loss in red - minor targets in grey dashed lines and major targets in black solid lines
Fundamentally this drop makes sense as there is a mass amount of liquidity in these below zones.
Not financial advice, do your own research and experimentations.
God speed!
Feragatname
Bilgiler ve yayınlar, TradingView tarafından sağlanan veya onaylanan finansal, yatırım, işlem veya diğer türden tavsiye veya tavsiyeler anlamına gelmez ve teşkil etmez. Kullanım Şartları'nda daha fazlasını okuyun.
Feragatname
Bilgiler ve yayınlar, TradingView tarafından sağlanan veya onaylanan finansal, yatırım, işlem veya diğer türden tavsiye veya tavsiyeler anlamına gelmez ve teşkil etmez. Kullanım Şartları'nda daha fazlasını okuyun.