Is Bitcoin about to break through by exploring the upper edge of triangle organization?

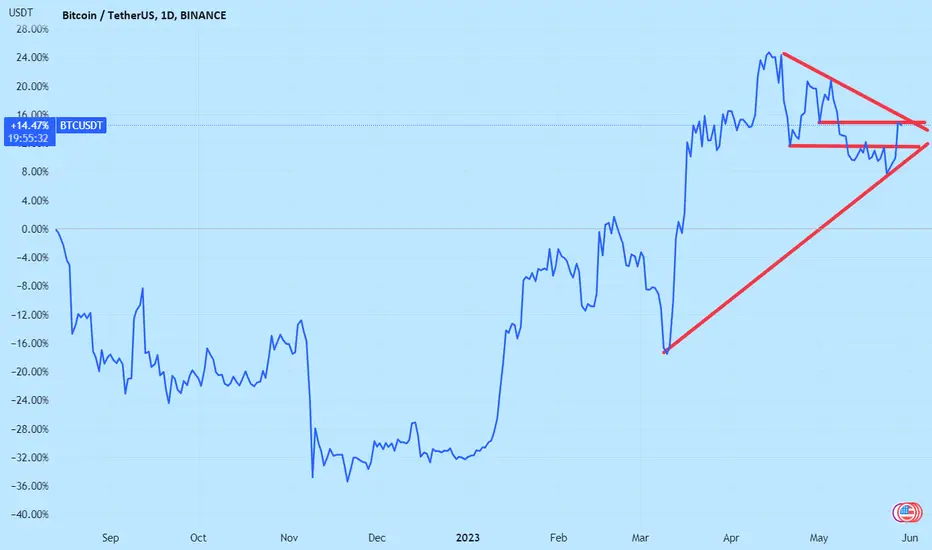
This figure shows the line chart of Bitcoin since September 2022. The graph overlays the lines between recent lows and lows, the lines between highs and highs, and the horizontal lines of recent bullish and bearish starting positions. As shown in the figure, Bitcoin has already faced strong pressure to break through the bearish starting point before the recent low point, opening up space! In the future, we need to focus on whether Bitcoin can break through the existing large triangle oscillation range in one go!
This figure shows the line chart of Bitcoin since September 2022. The graph overlays the lines between recent lows and lows, the lines between highs and highs, and the horizontal lines of recent bullish and bearish starting positions. As shown in the figure, Bitcoin has already faced strong pressure to break through the bearish starting point before the recent low point, opening up space! In the future, we need to focus on whether Bitcoin can break through the existing large triangle oscillation range in one go!
Feragatname
Bilgiler ve yayınlar, TradingView tarafından sağlanan veya onaylanan finansal, yatırım, işlem veya diğer türden tavsiye veya tavsiyeler anlamına gelmez ve teşkil etmez. Kullanım Şartları'nda daha fazlasını okuyun.
Feragatname
Bilgiler ve yayınlar, TradingView tarafından sağlanan veya onaylanan finansal, yatırım, işlem veya diğer türden tavsiye veya tavsiyeler anlamına gelmez ve teşkil etmez. Kullanım Şartları'nda daha fazlasını okuyun.