Hello, fellow traders.
If you "Follow," you'll always get the latest information quickly.
Have a great day.
-------------------------------------
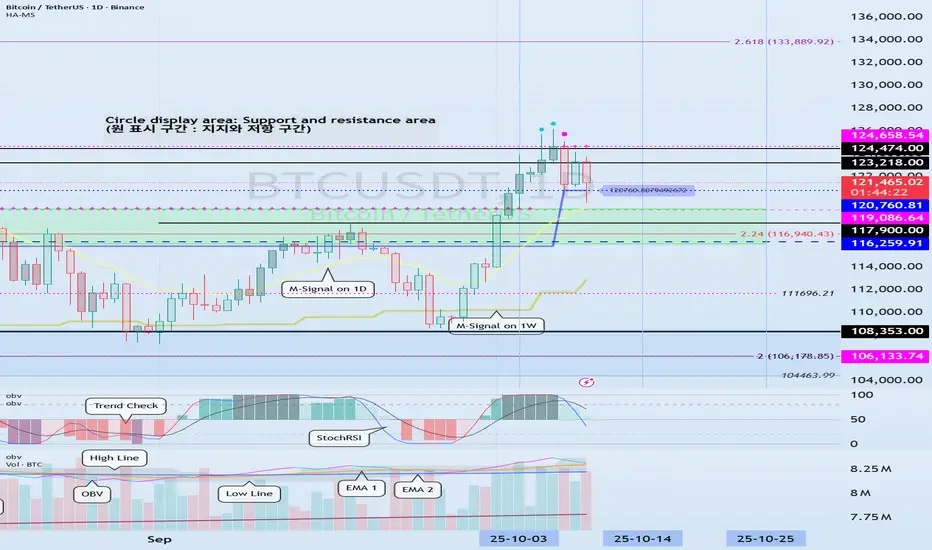
(BTCUSDT 1D chart)
The price rose after forming a DOM(-60) ~ HA-Low range, and is now forming a HA-High ~ DOM(60) range, showing a upward trajectory.
Trend-wise, a decline below the M-Signal indicator on the 1W chart is likely to initiate a downtrend, and a decline below the M-Signal indicator on the 1M chart is expected to initiate a downtrend.
Therefore, when the price falls to the HA-High ~ DOM (60) range, it's important to identify support and resistance levels formed at the M-Signal indicator on the 1W chart.
-
Therefore, it's important to maintain the price above the 116259.91-119086.64 range.
The next important range is the 104463.99-108353.0 range.
-
To break above these key levels or ranges,
- The StochRSI indicator must be trending upward. If possible, it's best to avoid entering the overbought zone.
- The On-By-Signal (OBV) indicator must be trending upward. If possible, it should remain above the High Line.
- The TC (Trend Check) indicator should show an upward trend. If possible, it should remain above the 0 level.
If the above conditions are met, an upward breakout of the HA-High ~ DOM (60) range is expected.
The next period of volatility is expected around October 14th (October 13th-15th).
-
Thank you for reading to the end.
I wish you successful trading.
--------------------------------------------------
- This is an explanation of the big picture.
(3-year bull market, 1-year bear market pattern)

I will explain in more detail when the bear market begins.
------------------------------------------------------
İşlem aktif
#BTCUSDTIf the price falls below the M-Signal indicator on the 1W chart, a downtrend is likely to begin.
If the OBV indicator falls below the EMA 2, further declines are likely.
※ Follow X to check out the posts.
※ X를 팔로우하고 게시물을 확인하세요.
◆ t.me/readCryptoChannel
[HA-MS Indicator]
bit.ly/3YxHgvN
[OBV Indicator]
bit.ly/4dcyny3
※ X를 팔로우하고 게시물을 확인하세요.
◆ t.me/readCryptoChannel
[HA-MS Indicator]
bit.ly/3YxHgvN
[OBV Indicator]
bit.ly/4dcyny3
İlgili yayınlar
Feragatname
Bilgiler ve yayınlar, TradingView tarafından sağlanan veya onaylanan finansal, yatırım, alım satım veya diğer türden tavsiye veya öneriler anlamına gelmez ve teşkil etmez. Kullanım Koşulları bölümünde daha fazlasını okuyun.