Here’s another practical example of “Will Bitcoin Move Up or Down?”
Will Bitcoin Move up or down from 108,500?
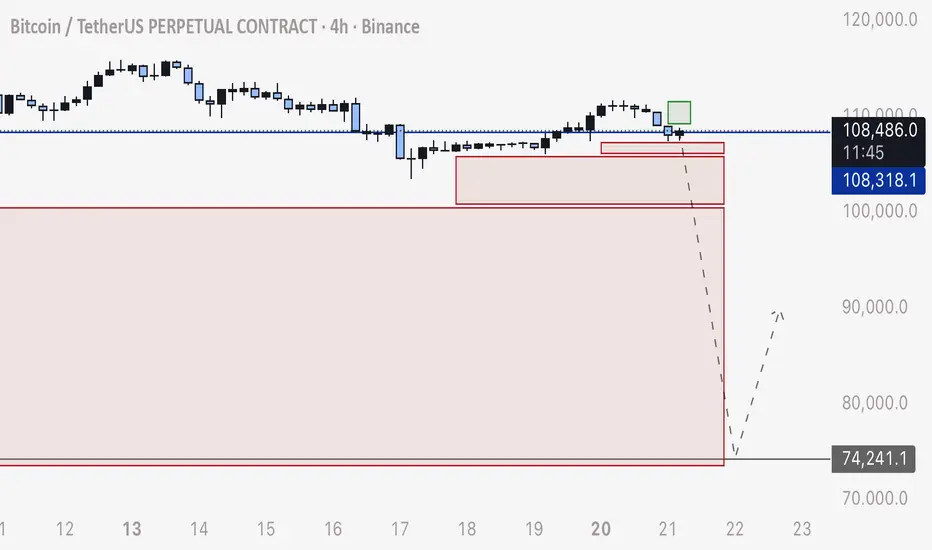
In this example we will be taking a trade from the consolidation point of 108,500
In my previous posts I’ve taught you how to draw order blocks of stop loss orders and use them to predict movement. We draw green boxes for BUY orders ABOVE price and red boxes for SELL orders BELOW price.
Note how this is opposite to how we are told to look at charts - with limit buys below and limit sells above. Stop Loss orders only full when price crosses the level and buys are above, sells are below.
In this example we will factor in Consolidation Time / Duration to predict price.
Although there are significant gaps of short stop losses above, the time of consolidation that collects the long stop loss orders is much larger in duration.
I’ve drawn the boxes here in widths to show length of time price has consolidated to attract these orders. The more time in consolidation without a recovery of these order blocks, the more orders are accumulated and therefor more buying or selling power.
Because there are much more long stop loss orders accumulated:
Bitcoin will DROP from 108,500 and we can set a take profit on the short at the end of this order block range at 78,000
Will Bitcoin Move up or down from 108,500?
In this example we will be taking a trade from the consolidation point of 108,500
In my previous posts I’ve taught you how to draw order blocks of stop loss orders and use them to predict movement. We draw green boxes for BUY orders ABOVE price and red boxes for SELL orders BELOW price.
Note how this is opposite to how we are told to look at charts - with limit buys below and limit sells above. Stop Loss orders only full when price crosses the level and buys are above, sells are below.
In this example we will factor in Consolidation Time / Duration to predict price.
Although there are significant gaps of short stop losses above, the time of consolidation that collects the long stop loss orders is much larger in duration.
I’ve drawn the boxes here in widths to show length of time price has consolidated to attract these orders. The more time in consolidation without a recovery of these order blocks, the more orders are accumulated and therefor more buying or selling power.
Because there are much more long stop loss orders accumulated:
Bitcoin will DROP from 108,500 and we can set a take profit on the short at the end of this order block range at 78,000
İlgili yayınlar
Feragatname
Bilgiler ve yayınlar, TradingView tarafından sağlanan veya onaylanan finansal, yatırım, alım satım veya diğer türden tavsiye veya öneriler anlamına gelmez ve teşkil etmez. Kullanım Koşulları bölümünde daha fazlasını okuyun.
İlgili yayınlar
Feragatname
Bilgiler ve yayınlar, TradingView tarafından sağlanan veya onaylanan finansal, yatırım, alım satım veya diğer türden tavsiye veya öneriler anlamına gelmez ve teşkil etmez. Kullanım Koşulları bölümünde daha fazlasını okuyun.