Hello Everyone, i hope you all doing good, Lets discuss about bitcoin. After weeks of consolidation and volatility, Bitcoin is back at its rising support zone, where strong hands usually step in. The structure on the weekly chart continues to hold higher lows, a clear sign that the broader trend remains bullish despite short-term pullbacks.
Technical View
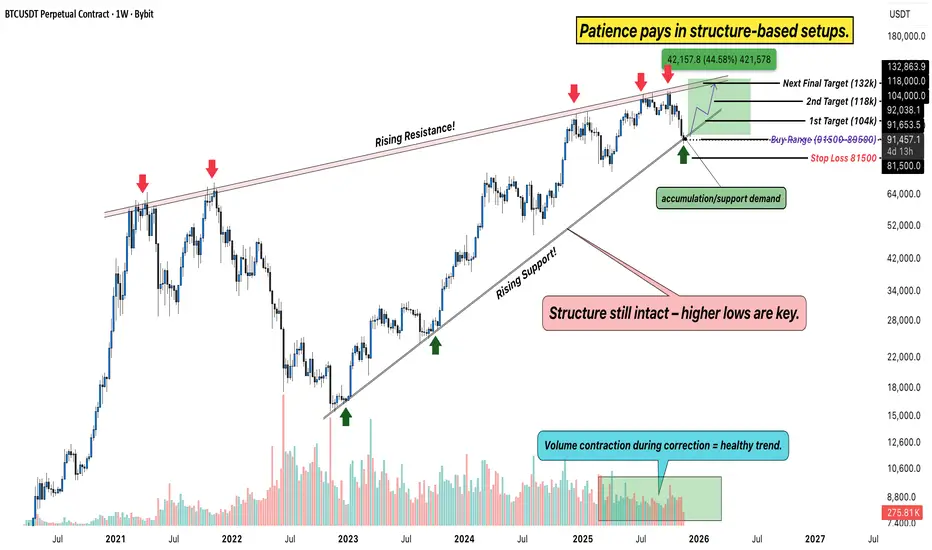
Rising Channel: BTC continues to move within a rising channel, with clear reactions from both support and resistance levels. The current price is testing the buy range between 81,600–89,500, an area that has historically acted as a high-probability reversal zone.
Resistance Levels: Key upside levels to watch are 104K, 118K, and the final target zone near 132K, the same rising resistance that rejected price multiple times in past cycles.
Support: As long as BTC stays above 81,500, the structure remains valid. A weekly close below this zone would invalidate the bullish bias.
Volume Behavior: Notice how each correction comes with lower volume, a healthy sign of accumulation, not distribution.
Big Picture
This phase often shakes out emotional traders while rewarding the ones who trust structure and time. If Bitcoin holds this zone and begins to bounce, it could mark the start of the next major wave, potentially aiming for a new cycle high in the coming months.
Rahul’s Insight: Big moves don’t start with hype, they start with quiet structure and strong conviction. The crowd reacts; the disciplined trader prepares.
Analysis By TraderRahulPal | More analysis & educational content on my profile.
Technical View
Rising Channel: BTC continues to move within a rising channel, with clear reactions from both support and resistance levels. The current price is testing the buy range between 81,600–89,500, an area that has historically acted as a high-probability reversal zone.
Resistance Levels: Key upside levels to watch are 104K, 118K, and the final target zone near 132K, the same rising resistance that rejected price multiple times in past cycles.
Support: As long as BTC stays above 81,500, the structure remains valid. A weekly close below this zone would invalidate the bullish bias.
Volume Behavior: Notice how each correction comes with lower volume, a healthy sign of accumulation, not distribution.
Big Picture
This phase often shakes out emotional traders while rewarding the ones who trust structure and time. If Bitcoin holds this zone and begins to bounce, it could mark the start of the next major wave, potentially aiming for a new cycle high in the coming months.
Rahul’s Insight: Big moves don’t start with hype, they start with quiet structure and strong conviction. The crowd reacts; the disciplined trader prepares.
Analysis By TraderRahulPal | More analysis & educational content on my profile.
Premium Signals: 77% accuracy in Intraday & Positional trades for Stocks, Nifty, Bank Nifty, Gold, Silver & Crypto. Take demo & decide — most traders don’t leave after joining.
Free Demo: wa.me/919560602464
Free Telegram: spf.bio/c1lkb
Free Demo: wa.me/919560602464
Free Telegram: spf.bio/c1lkb
İlgili yayınlar
Feragatname
Bilgiler ve yayınlar, TradingView tarafından sağlanan veya onaylanan finansal, yatırım, alım satım veya diğer türden tavsiye veya öneriler anlamına gelmez ve teşkil etmez. Kullanım Koşulları bölümünde daha fazlasını okuyun.