https://www.tradingview.com/x/tPIOYsKb/
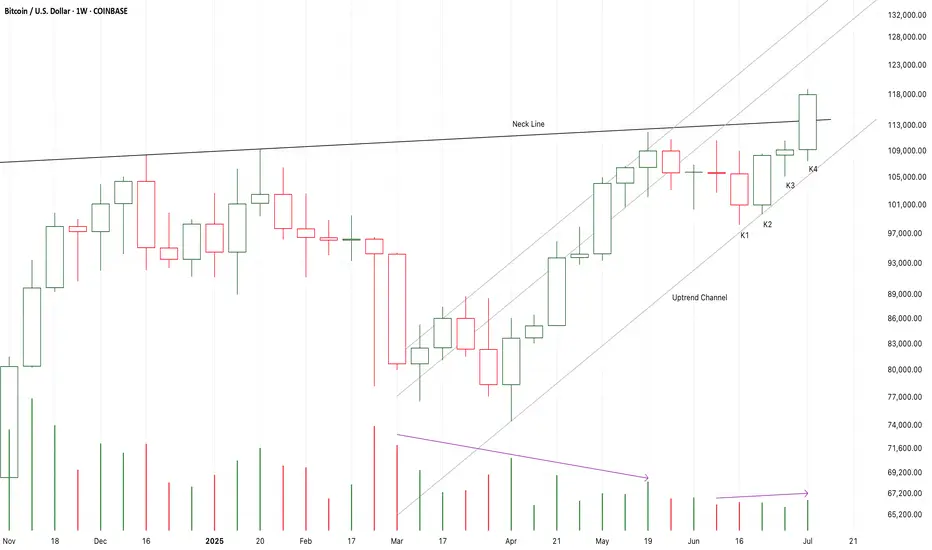
From K2 to K4,
It is a strong bullish three soldiers advancing pattern with increasing demands.
It is likely that K4 will close upon the high price area.
And, it is likely to be a valid break up here.
The potential target is about 127-130K after 3 weeks.
On the other hand,
Compared to the nearest motive move,
The demands keeps at the lowest level.
It is an early signal of weakness.
Perhaps this is a final motive wave.
I will try to get out of the market and even try to short it if the following candles move to the upper limit of the uptrend channel.
Also, I am expecting a doji candle of K5 to test the neck line.
It is a potential good place to buy it there.
Long-115518/Stop-111K/Target-127K
Long-114388/Stop-111K/Target-134K
İşlem aktif
From K1to K3,
It is a strong bullish three soldiers stalled pattern with increasing demands.
It is likely that K4 will close upon the high price area.
And, it is likely to be a valid break up and an accelerate motive wave here.
The potential target of the double bottom consolidation pattern at about 121-128K after 3 weeks.
At the same time,
The supply pressure sharply increased at K2,
It is an early signal of weakness.
Perhaps a small scale running flat pattern will consolidate around the upper limit of the channel,
And then, the market will keep accelerating.
I will try to get out of the market and even try to short it if the following candles move to 125K area.
Long-115888/Stop-111K/Target-127K
Feragatname
Bilgiler ve yayınlar, TradingView tarafından sağlanan veya onaylanan finansal, yatırım, işlem veya diğer türden tavsiye veya tavsiyeler anlamına gelmez ve teşkil etmez. Kullanım Şartları'nda daha fazlasını okuyun.
Feragatname
Bilgiler ve yayınlar, TradingView tarafından sağlanan veya onaylanan finansal, yatırım, işlem veya diğer türden tavsiye veya tavsiyeler anlamına gelmez ve teşkil etmez. Kullanım Şartları'nda daha fazlasını okuyun.