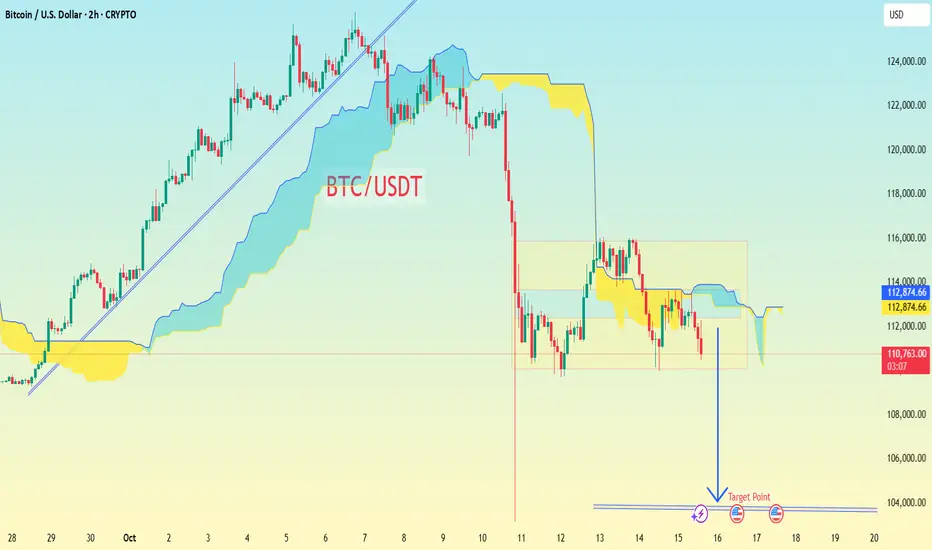
BTC/USDT chart 2-hour timeframe with Ichimoku Cloud and some support/resistance levels drawn.
Here’s what I can observe from the chart:
Current price: ≈ $110,520
Price structure: Clear break below support after a consolidation box (yellow rectangle).
There’s a downward arrow pointing to a “Target Point” around the price level 103,828 USDT.
This level appears to be the next major support zone based on my drawing.
📉 Short-term downside target
Based on the chart:
Primary target: $103,828 (as marked on my chart)
This target aligns with a measured move after breaking out of the consolidation range.
Next strong support zone is likely around the $103K–$105K area.
⚠ Important Note:
This is not financial advice — crypto markets are highly volatile. Targets can change quickly with volume spikes or fakeouts. Always use stop losses and manage risk appropriately.
İşlem aktif
active active📲 Join telegram channel free .
t.me/addlist/dg3uSwzkMSplNjFk
Forex, Gold & Crypto Signals with detailed analysis & get consistent results.
t.me/addlist/dg3uSwzkMSplNjFk
Gold Signal's with proper TP & SL for high profit opportunities.
t.me/addlist/dg3uSwzkMSplNjFk
Forex, Gold & Crypto Signals with detailed analysis & get consistent results.
t.me/addlist/dg3uSwzkMSplNjFk
Gold Signal's with proper TP & SL for high profit opportunities.
İlgili yayınlar
Feragatname
Bilgiler ve yayınlar, TradingView tarafından sağlanan veya onaylanan finansal, yatırım, işlem veya diğer türden tavsiye veya tavsiyeler anlamına gelmez ve teşkil etmez. Kullanım Şartları'nda daha fazlasını okuyun.
📲 Join telegram channel free .
t.me/addlist/dg3uSwzkMSplNjFk
Forex, Gold & Crypto Signals with detailed analysis & get consistent results.
t.me/addlist/dg3uSwzkMSplNjFk
Gold Signal's with proper TP & SL for high profit opportunities.
t.me/addlist/dg3uSwzkMSplNjFk
Forex, Gold & Crypto Signals with detailed analysis & get consistent results.
t.me/addlist/dg3uSwzkMSplNjFk
Gold Signal's with proper TP & SL for high profit opportunities.
İlgili yayınlar
Feragatname
Bilgiler ve yayınlar, TradingView tarafından sağlanan veya onaylanan finansal, yatırım, işlem veya diğer türden tavsiye veya tavsiyeler anlamına gelmez ve teşkil etmez. Kullanım Şartları'nda daha fazlasını okuyun.