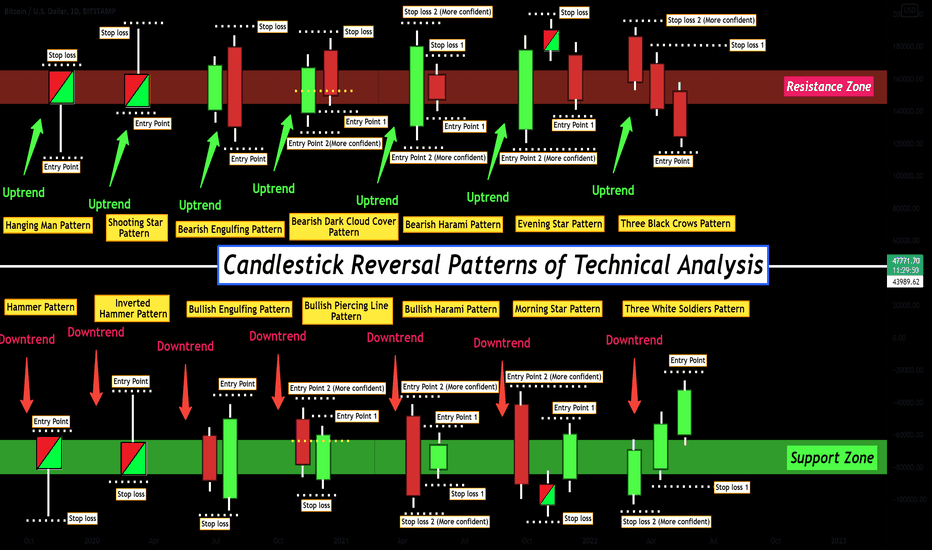
I tried to show you the most important Classic Reversal Patterns of Technical Analysis with their 🎯Targets🎯.
Please do not forget the ✅'like'✅ button 🙏😊 & Share it with your friends, Thanks, and Trade safe.
Please do not forget the ✅'like'✅ button 🙏😊 & Share it with your friends, Thanks, and Trade safe.
Not
🔴A head and shoulders pattern is a chart formation that appears as a baseline with three peaks, where the outside two are close in height and the middle is highest. In technical analysis, a head and shoulders pattern describes a specific chart formation that predicts a bullish-to-bearish trend reversal (All definitions for Inverse Head and Shoulder Pattern are the opposite).🔴The triple top is a type of chart pattern used in technical analysis to predict the reversal in the movement of an asset's price. Consisting of three peaks, a triple top signals that the asset may no longer be rallying, and that lower prices may be on the way (All definitions for Tripple Bottom Pattern are the opposite).
🔴A double top is an extremely bearish technical reversal pattern that forms after an asset reaches a high price two consecutive times with a moderate decline between the two highs. It is confirmed once the asset's price falls below a support level equal to the low between the two prior highs (All definitions for Double Bottom Pattern are the opposite).
🔴A diamond top formation is a technical analysis pattern that often occurs at, or near, market tops and can signal a reversal of an uptrend. It is so named because the trendlines connecting the peaks and troughs carved out by the security's price action form the shape of a diamond(All definitions for Diamond Bottom Pattern are the opposite).
🔴A cup and handle price pattern on a security's price chart is a technical indicator that resembles a cup with a handle, where the cup is in the shape of a "u" and the handle has a slight downward drift. The cup and handle is considered a bullish signal, with the right-hand side of the pattern typically experiencing lower trading volume. The pattern's formation may be as short as seven weeks or as long as 65 weeks(All definitions for Inverse Cup and Handle Pattern are the opposite).
🔴A rising wedge is a technical indicator, suggesting a reversal pattern frequently seen in bear markets. This pattern shows up in charts when the price moves upward with pivot highs and lows converging toward a single point known as the apex. Using two trend lines—one for drawing across two or more pivot highs and one connecting two or more pivot lows—convergence is apparent toward the upper right part of the chart(All definitions for Falling Wedge Pattern are the opposite).
🔴An ascending broadening wedge is a bearish chart pattern (said to be a reversal pattern). It is formed by two diverging bullish lines (All definitions for Descending Broadening Wedge Pattern are the opposite).
🎁Get a 20% Discount on your trading FEE on BYBIT:👉partner.bybit.com/b/PEJMANZWIN
Feragatname
Bilgiler ve yayınlar, TradingView tarafından sağlanan veya onaylanan finansal, yatırım, alım satım veya diğer türden tavsiye veya öneriler anlamına gelmez ve teşkil etmez. Kullanım Koşulları bölümünde daha fazlasını okuyun.


