Determining Bitcoin's Final Drop Using Fibonacci Levels
📊 Summary
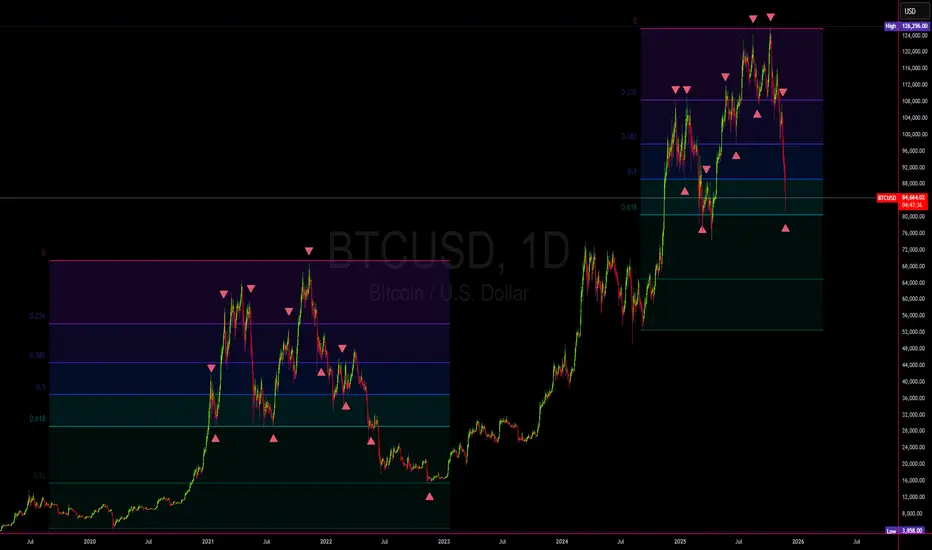
Based on historical Fibonacci and cyclical analysis, Bitcoin, after reaching its 2025 peak at **$124,000**, has entered a corrective phase similar to the 2021–2022 cycle. Currently, it is sitting near the 0.618 Fibonacci level (~$84,000), and if past patterns repeat, the next likely drop extends toward the **0.83 Fibonacci level at $65,000**.
🔹 Cycle Comparison
Phase Fibo Level 2021 Cycle 2025 Cycle (Projection)
-------------------------------------------------------------------------
Cycle Top 0.0 $69,000 $124,000
Mid Correction 0.5 $47,000 $83,000
Major Support 0.618 $42,000 $74,000
Final Support 0.83 $29,000 **$65,000**
🔻 Current Trend Analysis
1. After a strong rally to 124K, Bitcoin has started a structured correction.
2. The price is consolidating around 84K, similar to its 2021 sideways phase before a drop.
3. If the pattern repeats, the next leg down targets around 65K before potential stabilization.
🎯 Final Outlook
The $65,000 zone is expected to be a temporary cycle bottom and key support area for Bitcoin.
If this zone fails, the next long-term support lies near $52,000
💬 If you agree with this analysis, give it a like 👍 and if you have a different view, share it in the comments so
📊 Summary
Based on historical Fibonacci and cyclical analysis, Bitcoin, after reaching its 2025 peak at **$124,000**, has entered a corrective phase similar to the 2021–2022 cycle. Currently, it is sitting near the 0.618 Fibonacci level (~$84,000), and if past patterns repeat, the next likely drop extends toward the **0.83 Fibonacci level at $65,000**.
🔹 Cycle Comparison
Phase Fibo Level 2021 Cycle 2025 Cycle (Projection)
-------------------------------------------------------------------------
Cycle Top 0.0 $69,000 $124,000
Mid Correction 0.5 $47,000 $83,000
Major Support 0.618 $42,000 $74,000
Final Support 0.83 $29,000 **$65,000**
🔻 Current Trend Analysis
1. After a strong rally to 124K, Bitcoin has started a structured correction.
2. The price is consolidating around 84K, similar to its 2021 sideways phase before a drop.
3. If the pattern repeats, the next leg down targets around 65K before potential stabilization.
🎯 Final Outlook
The $65,000 zone is expected to be a temporary cycle bottom and key support area for Bitcoin.
If this zone fails, the next long-term support lies near $52,000
💬 If you agree with this analysis, give it a like 👍 and if you have a different view, share it in the comments so
İlgili yayınlar
Feragatname
Bilgiler ve yayınlar, TradingView tarafından sağlanan veya onaylanan finansal, yatırım, alım satım veya diğer türden tavsiye veya öneriler anlamına gelmez ve teşkil etmez. Kullanım Koşulları bölümünde daha fazlasını okuyun.
İlgili yayınlar
Feragatname
Bilgiler ve yayınlar, TradingView tarafından sağlanan veya onaylanan finansal, yatırım, alım satım veya diğer türden tavsiye veya öneriler anlamına gelmez ve teşkil etmez. Kullanım Koşulları bölümünde daha fazlasını okuyun.