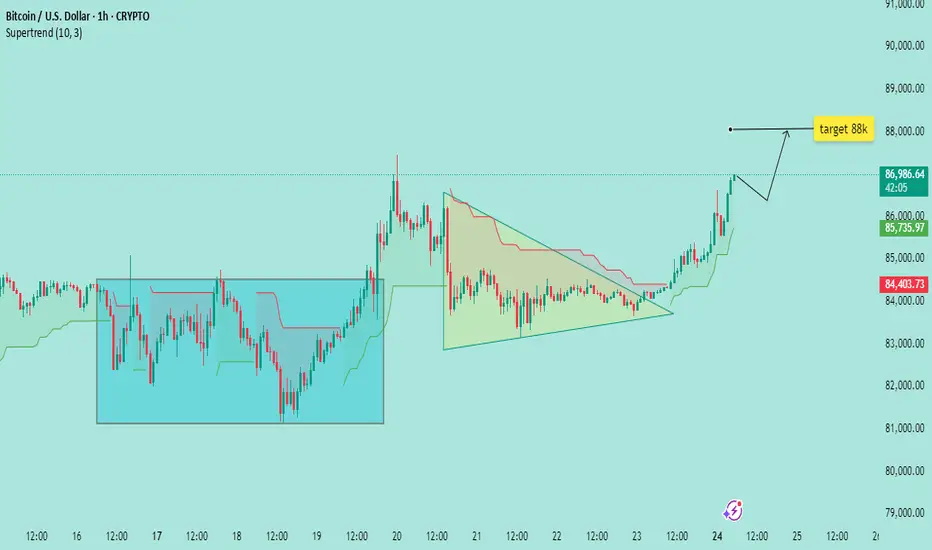
This 1-hour Bitcoin (BTC/USD) chart from TradingView highlights a breakout from a consolidation phase and a bullish pennant formation, signaling a strong upward move. The price has surged past the $86,900 level, with the next target set at $88,000. The Supertrend indicator (10,3) is supporting the bullish bias, while previous resistance levels have turned into potential support. If momentum continues, BTC could test new highs in the short term. Traders should watch for confirmation of the breakout and potential retracements before further gains.
Note: This is not a trading signal, just my personal analysis based on current market trends.
Note: This is not a trading signal, just my personal analysis based on current market trends.
İşlem aktif
wow target is near to hit İşlem kapandı: hedefe ulaştı
CONGRATES TARGET HIT Successfullyİlgili yayınlar
Feragatname
Bilgiler ve yayınlar, TradingView tarafından sağlanan veya onaylanan finansal, yatırım, işlem veya diğer türden tavsiye veya tavsiyeler anlamına gelmez ve teşkil etmez. Kullanım Şartları'nda daha fazlasını okuyun.
İlgili yayınlar
Feragatname
Bilgiler ve yayınlar, TradingView tarafından sağlanan veya onaylanan finansal, yatırım, işlem veya diğer türden tavsiye veya tavsiyeler anlamına gelmez ve teşkil etmez. Kullanım Şartları'nda daha fazlasını okuyun.