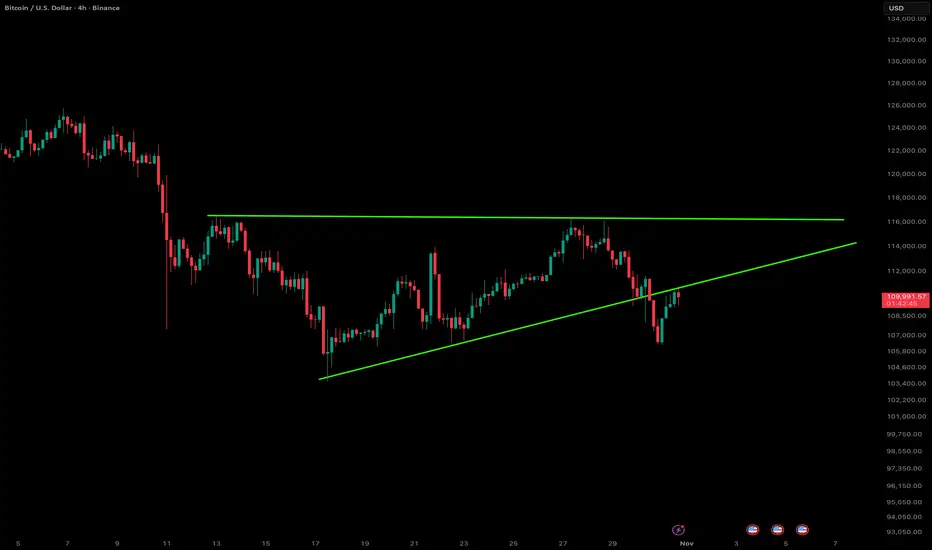
Bitcoin just slipped below the ascending triangle support on the 4-hour chart, signaling a potential shift in short-term momentum. The structure had been forming higher lows toward the $115K resistance zone, but sellers stepped in hard near the top, breaking the trendline that’s been guiding the uptrend since mid-October.
The move comes amid broader weakness across the crypto market — BTC has shed about 3.7% this month, while altcoins like XRP and ETH are also struggling. Despite the pullback, Bitcoin still holds an impressive 18% gain for the year, so the bigger picture remains constructive.
Macro pressure seems to be weighing on sentiment — investor caution around interest rates, inflation, and the Fed’s next move is keeping volatility elevated. If upcoming data tilts toward another rate cut, we could see renewed upside momentum. But for now, price action suggests a possible retest of lower zones before bulls can re-establish control.
Overall, a clean technical breakdown in the near term, but the broader trend isn’t broken yet. Let’s see if bulls can reclaim that triangle support in the next few sessions.
DONT FORGET TO CHECK MY PROFILE BELOW 👇👇👇
👉👉👉 I am using indicators from Risological.com
✅ Works on all markets
✅ 30-Day Money-Back Guarantee.
👉👉👉 CHECK IT OUT @ Risological.com
✅ Works on all markets
✅ 30-Day Money-Back Guarantee.
👉👉👉 CHECK IT OUT @ Risological.com
İlgili yayınlar
Feragatname
Bilgiler ve yayınlar, TradingView tarafından sağlanan veya onaylanan finansal, yatırım, alım satım veya diğer türden tavsiye veya öneriler anlamına gelmez ve teşkil etmez. Kullanım Koşulları bölümünde daha fazlasını okuyun.