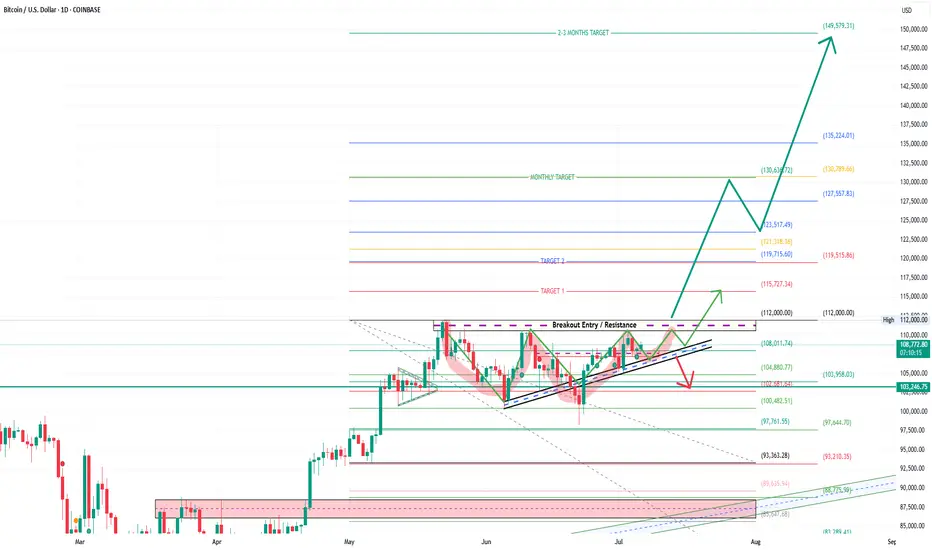
Bitcoin is forming a strong ascending triangle pattern, approaching a key horizontal resistance zone near $112,000, as marked by “Breakout Entry / Resistance” on the chart.
The price structure shows higher lows converging under a flat top, which indicates potential energy build-up for a major breakout. The setup suggests strong bullish momentum if the breakout confirms with volume.
Key Levels & Targets:
Breakout Level: $112,000
Target 1: $115,727
Target 2: $123,517
Monthly Target: $130,639
Extended Targets (2–3 Month Outlook): $135,224 → $149,579
Support Zones to Watch:
$108,011 → $104,880 (ascending trendline)
$103,958 → $100,482 (critical support)
Breakdown invalidation: Below $97,761 could trigger deeper downside
Trade Plan:
Entry Zone: On breakout above $112,000
Stop Loss: Below $104,880 (aggressive), or $103,246 (safe)
Target Path: $115K → $123K → $130K → $149K
Pattern: Ascending Triangle Breakout
Risk-Reward: High reward with well-defined risk control
Bitcoin’s trend is aligning with strong demand and pattern continuation signals, supported by breakout volume zones and long-term Fibonacci levels. This may be the start of a major leg higher if resistance is flipped to support.
Disclaimer:
This chart is for educational purposes only. Please consult your financial advisor and apply proper risk management before entering or exiting trades.
Not
SUBSCRIBE to @TheBreakoutAnalyst on YOUTUBE– your ultimate destination for sharp, real-time stock market insights! 📈 On this channel, we break down powerful breakout setups, provide BTST/STBT ideas, and deliver intraday trading strategies with clear technical analysis. Whether you're a beginner or a seasoned trader, @TheBreakoutAnalyst helps you stay ahead with actionable charts, timely updates, and no-fluff market breakdowns. Subscribe now and trade smarter every day! 💹Feragatname
Bilgiler ve yayınlar, TradingView tarafından sağlanan veya onaylanan finansal, yatırım, işlem veya diğer türden tavsiye veya tavsiyeler anlamına gelmez ve teşkil etmez. Kullanım Şartları'nda daha fazlasını okuyun.
Feragatname
Bilgiler ve yayınlar, TradingView tarafından sağlanan veya onaylanan finansal, yatırım, işlem veya diğer türden tavsiye veya tavsiyeler anlamına gelmez ve teşkil etmez. Kullanım Şartları'nda daha fazlasını okuyun.
