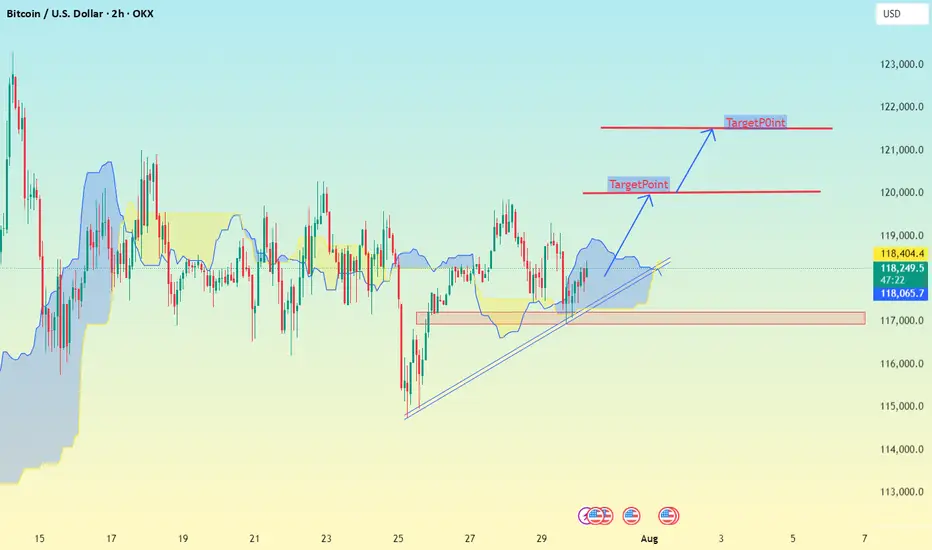
✅ Chart Analysis (2h Timeframe)
MY using Ichimoku Cloud, support/resistance zones, and trend lines.
Price is currently around 118,319 USD.
It has broken out of the Ichimoku cloud and is respecting the trendline support, indicating bullish momentum.
---
🎯 Upside Target Levels
🔵 Target 1:
Level: ~120,000 USD
Reason: Horizontal resistance (clearly marked)
Action: Minor profit-taking or partial exit
🔵 Target 2 (Main):
Level: ~122,000 USD
Reason: Second resistance zone & projected move from breakout
Action: Ideal full target zone
---
🔻 Support & Invalidations
🟡 Immediate Support Zone:
Levels:
118,404
118,296
118,065
These are dynamic Ichimoku & short-term support levels
📲 Join telegram channel free .
t.me/addlist/dg3uSwzkMSplNjFk
Forex, Gold & Crypto Signals with detailed analysis & get consistent results.
t.me/addlist/dg3uSwzkMSplNjFk
Gold Signal's with proper TP & SL for high profit opportunities.
t.me/addlist/dg3uSwzkMSplNjFk
Forex, Gold & Crypto Signals with detailed analysis & get consistent results.
t.me/addlist/dg3uSwzkMSplNjFk
Gold Signal's with proper TP & SL for high profit opportunities.
Feragatname
Bilgiler ve yayınlar, TradingView tarafından sağlanan veya onaylanan finansal, yatırım, alım satım veya diğer türden tavsiye veya öneriler anlamına gelmez ve teşkil etmez. Kullanım Koşulları bölümünde daha fazlasını okuyun.