As of today, the direction of Bitcoin is fluctuating downward. From the 4-hour K-line, the price has fallen sharply compared with February 27, and has rebounded compared with February 26. The last K-line is a positive line, and the closing price is greater than the opening price. Bitcoin once fell below $79,000 during the session, and finally rebounded to more than $6,000. The overall decline in February was nearly 20%. This drastic price fluctuation reflects the fierce game between the long and short sides of the market.
Global geopolitical conflicts have intensified, making traders more risk-averse. As "digital gold", Bitcoin has obvious risk-averse properties, attracting some capital inflows seeking to hedge the risks of traditional assets. However, the rejection of the Bitcoin bill by South Dakota in the United States and the hacker attack on the Bybit exchange have triggered a market crisis, and traders have panicked and sold, causing Bitcoin prices to be under pressure.
At present, from the perspective of the MACD indicator, there is no obvious trend in the current market. The MACD bar chart continues to be positive and gradually becomes longer, indicating that the strength of the long army has a tendency to increase, but combined with the price fluctuations and declines, the strength of the long and short forces is in a relatively stalemate.
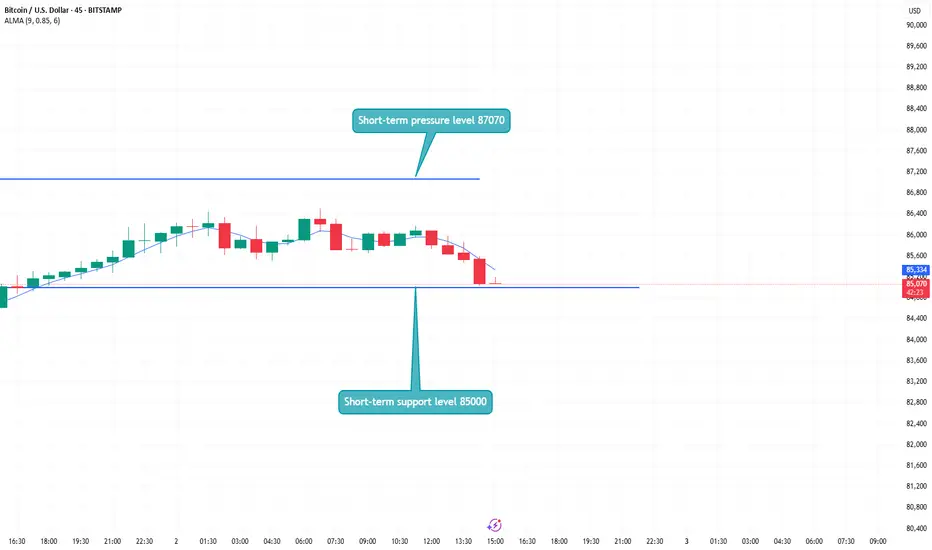
The current upper pressure level is 87070. If it can break through $85640 and stabilize, it may continue to rise to around 86250, but it may face pressure again at this position and experience a downward correction. BTCUSD BTCUSD BTCUSD
Global geopolitical conflicts have intensified, making traders more risk-averse. As "digital gold", Bitcoin has obvious risk-averse properties, attracting some capital inflows seeking to hedge the risks of traditional assets. However, the rejection of the Bitcoin bill by South Dakota in the United States and the hacker attack on the Bybit exchange have triggered a market crisis, and traders have panicked and sold, causing Bitcoin prices to be under pressure.
At present, from the perspective of the MACD indicator, there is no obvious trend in the current market. The MACD bar chart continues to be positive and gradually becomes longer, indicating that the strength of the long army has a tendency to increase, but combined with the price fluctuations and declines, the strength of the long and short forces is in a relatively stalemate.
The current upper pressure level is 87070. If it can break through $85640 and stabilize, it may continue to rise to around 86250, but it may face pressure again at this position and experience a downward correction.
Continuously release precise trading plans to lead members to expand profits, with a stable profit of 988% every month. If you have not made a profit yet, then join us. t.me/fahsufnwks
Feragatname
Bilgiler ve yayınlar, TradingView tarafından sağlanan veya onaylanan finansal, yatırım, işlem veya diğer türden tavsiye veya tavsiyeler anlamına gelmez ve teşkil etmez. Kullanım Şartları'nda daha fazlasını okuyun.