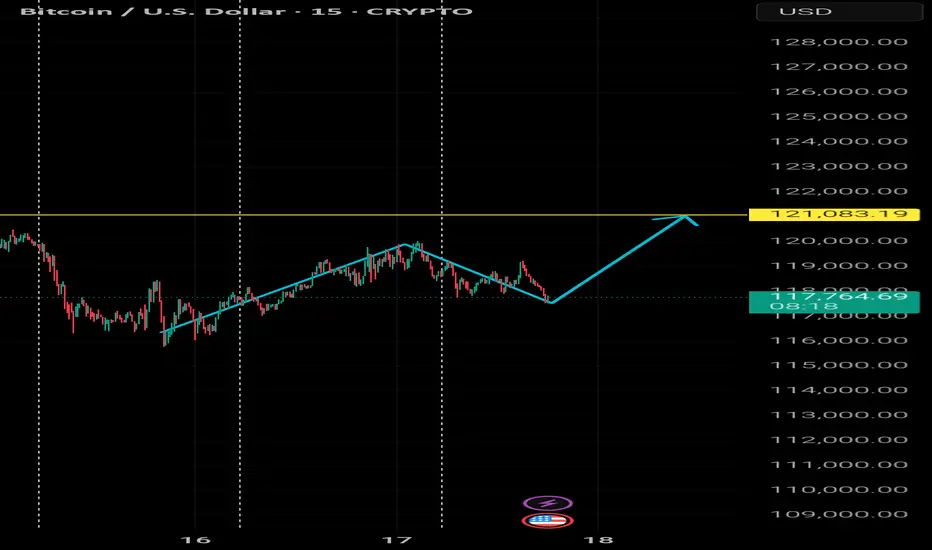
In this 15-minute chart of BTCUSD, we can observe a potential bullish reversal pattern forming—commonly referred to as a "W" or double bottom. The price recently retraced from the 119000 zone and found support around 117000, completing the second leg of the pattern.
The structure indicates strong buying interest at lower levels and a possible continuation to the upside. If the pattern completes, we can expect the price to break above the neckline resistance at 119500 and target the next key resistance level at 121083.19, marked by the yellow horizontal line.
Trade Plan:
Entry: Around 117500–118000 (after confirmation of support)
Target: 121083
Stop Loss: Below recent swing low ~116500
Risk-to-Reward: Approximately 1:2+
This setup is valid as long as the price holds above the 116500 level. A break below that would invalidate the bullish structure.
Feragatname
Bilgiler ve yayınlar, TradingView tarafından sağlanan veya onaylanan finansal, yatırım, işlem veya diğer türden tavsiye veya tavsiyeler anlamına gelmez ve teşkil etmez. Kullanım Şartları'nda daha fazlasını okuyun.
Feragatname
Bilgiler ve yayınlar, TradingView tarafından sağlanan veya onaylanan finansal, yatırım, işlem veya diğer türden tavsiye veya tavsiyeler anlamına gelmez ve teşkil etmez. Kullanım Şartları'nda daha fazlasını okuyun.