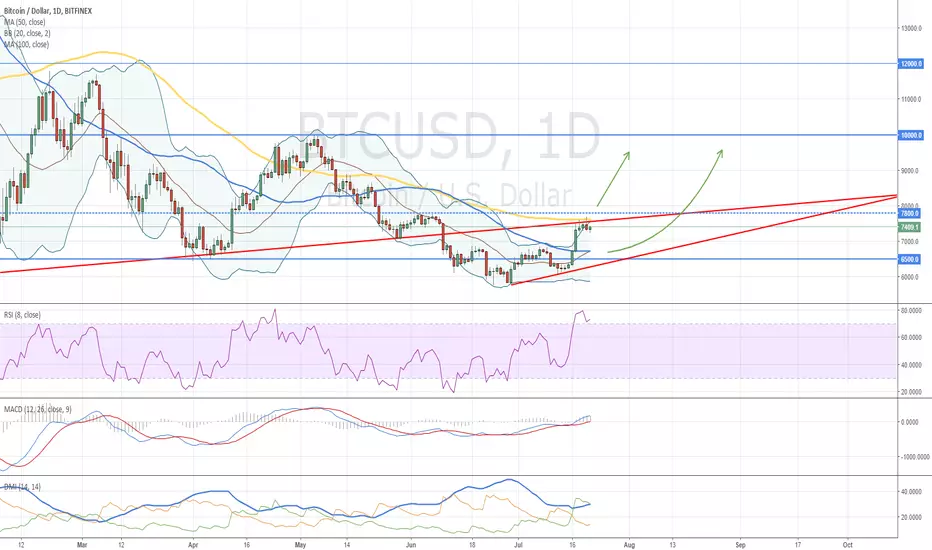
Bitcoin reached SMA100 and could not break it from the 1st attempt. This resistance zone is strong and it's formed by the uptrend line, SMA100 and 7800.00 resistance level. RSI is in the overbought zone and it confirms the price reversal. MACD lines still confirm the upward movement, but MACD histogram already falls and gives a bearish signal. DMI is bullish and ADX confirms strength of bulls and trend market conditions. The market should correct the previous upward movement and start a new one from the support zone formed by a new uptrend line and 6500.00 support levels. Long positions will be opened based on a reversal signal.
Alternative variant: if BTC does not fall but continues the upward movement and it breaks the resistance, we'll be able to join to this movement based on a breakout signal.
Alternative variant: if BTC does not fall but continues the upward movement and it breaks the resistance, we'll be able to join to this movement based on a breakout signal.
Not
If you think this information is helpful, please support my posts by your LIKEs! It will motivate me to write more posts and share with you my ideas about the markets. Thank you!Not
The price breaks SMA100 and it's goign to move above 7800.00 resistance level. The daily close price will confirm the breakout or may be the market will give us a reversal candlestick pattern. We'll see in several hours. If the price breaks the resistance zone, the next barrier will be 8000.00 resistance level. Watch for the price action in this zone. 💰COPY MY TRADES FOR FREE! Join 👉 bit.ly/41DKDBD
📣 Get Welcome Bonuses for 1st Trade 👉 bit.ly/bonus_bybit
💎 Share My BEST Trades here 👉 bit.ly/wubits
📣 Get Welcome Bonuses for 1st Trade 👉 bit.ly/bonus_bybit
💎 Share My BEST Trades here 👉 bit.ly/wubits
İlgili yayınlar
Feragatname
Bilgiler ve yayınlar, TradingView tarafından sağlanan veya onaylanan finansal, yatırım, işlem veya diğer türden tavsiye veya tavsiyeler anlamına gelmez ve teşkil etmez. Kullanım Şartları'nda daha fazlasını okuyun.
💰COPY MY TRADES FOR FREE! Join 👉 bit.ly/41DKDBD
📣 Get Welcome Bonuses for 1st Trade 👉 bit.ly/bonus_bybit
💎 Share My BEST Trades here 👉 bit.ly/wubits
📣 Get Welcome Bonuses for 1st Trade 👉 bit.ly/bonus_bybit
💎 Share My BEST Trades here 👉 bit.ly/wubits
İlgili yayınlar
Feragatname
Bilgiler ve yayınlar, TradingView tarafından sağlanan veya onaylanan finansal, yatırım, işlem veya diğer türden tavsiye veya tavsiyeler anlamına gelmez ve teşkil etmez. Kullanım Şartları'nda daha fazlasını okuyun.