Bitcoin (BTCUSD) Analysis – 2H Timeframe
1. Market Structure & Current Position
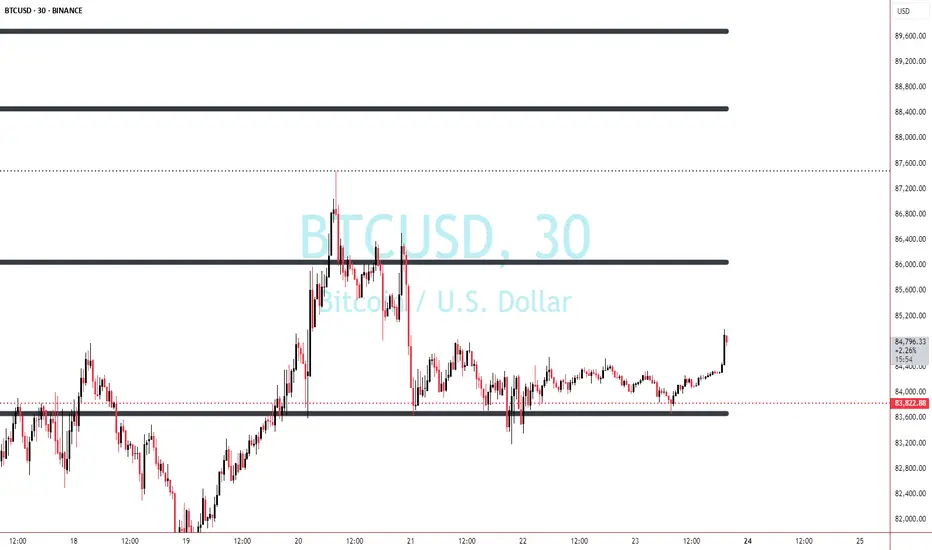
Bitcoin has been ranging after a sharp drop from 97,000 to 83,000.
It recently attempted a recovery but is struggling around the 84,300-84,800 zone.
Consolidation structure suggests accumulation or distribution before a significant move.
The previous high around 97,000 is still a major point of interest.
2. Key Technical Levels
Resistance Levels:
85,800 – 86,300 (Short-term resistance)
88,900 – 89,300 (Gann level + liquidity zone)
97,000 – 97,500 (Key swing high)
Support Levels:
83,000 (Current support)
81,800 – 82,000 (Strong demand area)
77,300 (Deep retracement Gann support)
3. Probable Scenarios & Probability %
➡️ Bullish Scenario (60%)
If BTC breaks above 85,800, it could push towards 88,900 (liquidity grab level).
A breakout above 89,300 confirms a rally towards 97,000 (previous swing high).
Elliott Wave suggests this could be Wave 3 of a bullish impulse, targeting higher Fibonacci extensions.
➡️ Bearish Scenario (40%)
If BTC fails to hold above 83,000, a drop to 81,800 – 82,000 is likely.
Breaking 81,800 opens the door to 77,300 (Gann retracement level)
A failure here suggests deeper correction or accumulation for a larger move later.
4. Conclusion & Trading Strategy
📌 Bias: Bullish above 85,800, cautious below 83,000.
📌 Entry Points:
Aggressive Buy: Above 85,800 if momentum confirms.
Safer Buy: Retest of 83,000 with strong bullish reaction.
📌 Risk Management:
Stop Loss: Below 81,800 for buys.
Take Profit: 88,900 → 89,300 → 97,000.
1. Market Structure & Current Position
Bitcoin has been ranging after a sharp drop from 97,000 to 83,000.
It recently attempted a recovery but is struggling around the 84,300-84,800 zone.
Consolidation structure suggests accumulation or distribution before a significant move.
The previous high around 97,000 is still a major point of interest.
2. Key Technical Levels
Resistance Levels:
85,800 – 86,300 (Short-term resistance)
88,900 – 89,300 (Gann level + liquidity zone)
97,000 – 97,500 (Key swing high)
Support Levels:
83,000 (Current support)
81,800 – 82,000 (Strong demand area)
77,300 (Deep retracement Gann support)
3. Probable Scenarios & Probability %
➡️ Bullish Scenario (60%)
If BTC breaks above 85,800, it could push towards 88,900 (liquidity grab level).
A breakout above 89,300 confirms a rally towards 97,000 (previous swing high).
Elliott Wave suggests this could be Wave 3 of a bullish impulse, targeting higher Fibonacci extensions.
➡️ Bearish Scenario (40%)
If BTC fails to hold above 83,000, a drop to 81,800 – 82,000 is likely.
Breaking 81,800 opens the door to 77,300 (Gann retracement level)
A failure here suggests deeper correction or accumulation for a larger move later.
4. Conclusion & Trading Strategy
📌 Bias: Bullish above 85,800, cautious below 83,000.
📌 Entry Points:
Aggressive Buy: Above 85,800 if momentum confirms.
Safer Buy: Retest of 83,000 with strong bullish reaction.
📌 Risk Management:
Stop Loss: Below 81,800 for buys.
Take Profit: 88,900 → 89,300 → 97,000.
İşlem kapandı: hedefe ulaştı
the buy active with 4000 points .Feragatname
Bilgiler ve yayınlar, TradingView tarafından sağlanan veya onaylanan finansal, yatırım, işlem veya diğer türden tavsiye veya tavsiyeler anlamına gelmez ve teşkil etmez. Kullanım Şartları'nda daha fazlasını okuyun.
Feragatname
Bilgiler ve yayınlar, TradingView tarafından sağlanan veya onaylanan finansal, yatırım, işlem veya diğer türden tavsiye veya tavsiyeler anlamına gelmez ve teşkil etmez. Kullanım Şartları'nda daha fazlasını okuyun.