Technical Analysis and Outlook:
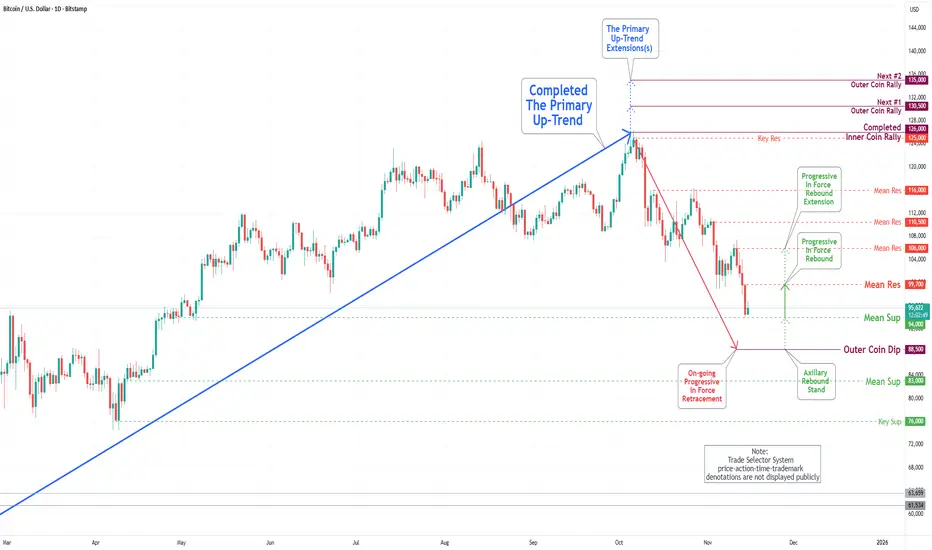
In the most recent trading session, the Bitcoin market has undergone a significant drawdown over the past week, reaching the Mean Support level of 99,000. Additionally, it has completed the Outer Coin Dip at 97,000. Compounding these challenges, the price has also declined to the Key Support level of 94,000, where trading activity is currently concentrated.
At this time, the price is being maintained within a trading range defined by the Mean Resistance at 99,700 and the Mean Support (Former Key Support) at 94,000, with a slight probability of an extension to the Mean Support level at 106,000. Nonetheless, it is crucial to acknowledge the considerable potential for pullbacks at these critical resistance levels.
İlgili yayınlar
Feragatname
Bilgiler ve yayınlar, TradingView tarafından sağlanan veya onaylanan finansal, yatırım, alım satım veya diğer türden tavsiye veya öneriler anlamına gelmez ve teşkil etmez. Kullanım Koşulları bölümünde daha fazlasını okuyun.
Feragatname
Bilgiler ve yayınlar, TradingView tarafından sağlanan veya onaylanan finansal, yatırım, alım satım veya diğer türden tavsiye veya öneriler anlamına gelmez ve teşkil etmez. Kullanım Koşulları bölümünde daha fazlasını okuyun.