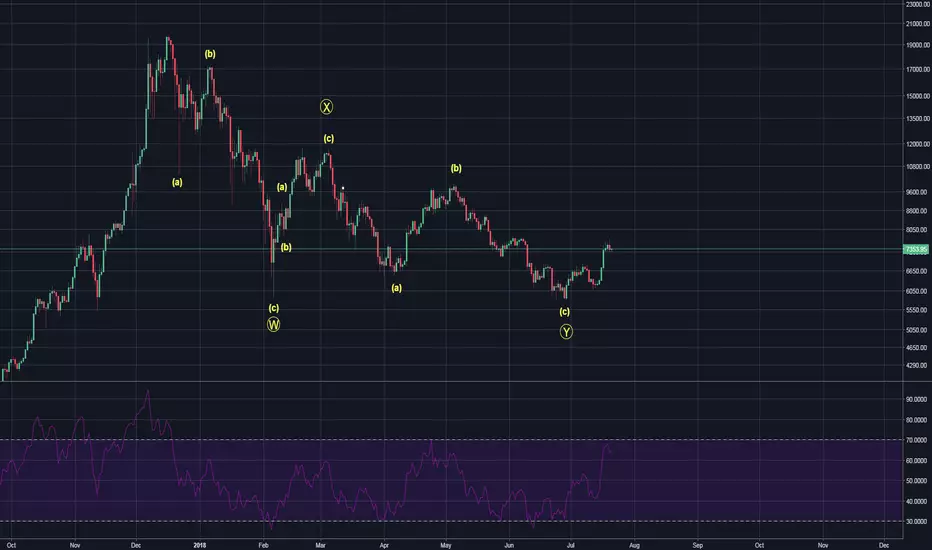
The below is the 2015 Elliot Wave correction count. As you can see, the RSI lines up with the 2018 count I drew above.

There are many traders with a double zigzag Elliot Wave count towards 4,800 - but looking at the RSI, it doesn't make sense to be to have a sub-wave 4 (current move upwards) when daily RSI is over 60 - we're talking about an impulsive wave downwards with a sub-wave daily RSI over 60 (it is very strange). But again, this is just based on probabilities.
There are many traders with a double zigzag Elliot Wave count towards 4,800 - but looking at the RSI, it doesn't make sense to be to have a sub-wave 4 (current move upwards) when daily RSI is over 60 - we're talking about an impulsive wave downwards with a sub-wave daily RSI over 60 (it is very strange). But again, this is just based on probabilities.
Feragatname
Bilgiler ve yayınlar, TradingView tarafından sağlanan veya onaylanan finansal, yatırım, işlem veya diğer türden tavsiye veya tavsiyeler anlamına gelmez ve teşkil etmez. Kullanım Şartları'nda daha fazlasını okuyun.
Feragatname
Bilgiler ve yayınlar, TradingView tarafından sağlanan veya onaylanan finansal, yatırım, işlem veya diğer türden tavsiye veya tavsiyeler anlamına gelmez ve teşkil etmez. Kullanım Şartları'nda daha fazlasını okuyun.