Satış
Can the Kiss of Death send Bitcoin to 2300?
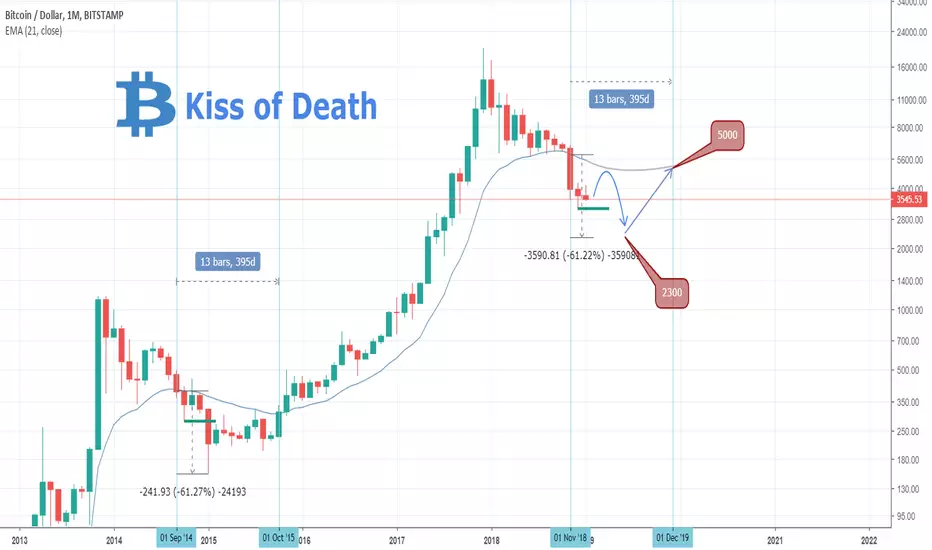
Pattern: Kiss of Death on 1M.
Signal: Bearish.
Target: 2300.
This is a typical bearish pattern. The price falls below the 21EMA and revisits the line from below, "kissing" it and getting rejected. In 2014/2015 it bottomed after a -61.27% fall. The same degree puts the bearish target/ bottom at 2300. The duration of the 2014/2015 pattern until the time it broke the 21EMA was 395 days. This places the start of the next bullish run on December 2019.
👑Best Signals (Forex/Crypto+70% accuracy) & Account Management (+20% profit/month on 10k accounts)
💰Free Channel t.me/tradingshotglobal
🤵Contact info@tradingshot.com t.me/tradingshot
🔥New service: next X100 crypto GEMS!
💰Free Channel t.me/tradingshotglobal
🤵Contact info@tradingshot.com t.me/tradingshot
🔥New service: next X100 crypto GEMS!
Feragatname
Bilgiler ve yayınlar, TradingView tarafından sağlanan veya onaylanan finansal, yatırım, işlem veya diğer türden tavsiye veya tavsiyeler anlamına gelmez ve teşkil etmez. Kullanım Şartları'nda daha fazlasını okuyun.