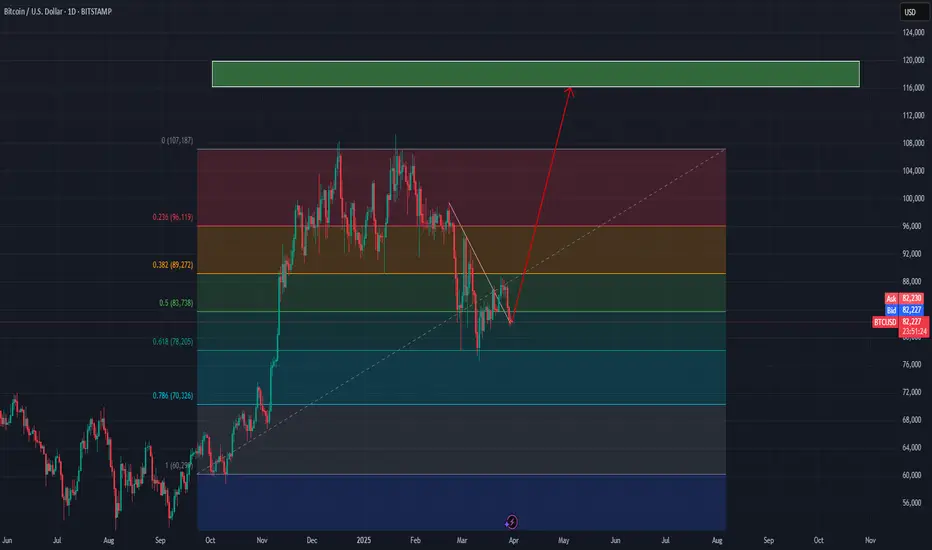
The chart uses Fibonacci retracement from a low of around $60,290 to a high of $107,187 to find potential support and resistance levels.
Key levels:
0.236 (23.6%) at $96,119 (resistance)
0.382 (38.2%) at $89,272
0.5 (50%) at $83,738 (current price zone)
0.618 (61.8%) at $78,205 (strong support)
0.786 (78.6%) at $70,326
Current Price Action
BTC is currently trading around $83,361.
It has retraced to the 50% Fibonacci level, which is often seen as a critical zone for trend continuation.
Trend Projection
A downward trendline was broken, suggesting a possible trend reversal.
A bullish move (red arrow) is projected, targeting the green resistance box around $116,000 - $120,000.
The price needs to break above $89,272 and $96,119 to confirm this upward move.
Key Takeaway
If BTC holds above the 50% retracement level and continues upward, it could be aiming for a new high.
If it fails, it may retest the $78,205 or $70,326 support levels before another attempt at breaking out.
Feragatname
Bilgiler ve yayınlar, TradingView tarafından sağlanan veya onaylanan finansal, yatırım, işlem veya diğer türden tavsiye veya tavsiyeler anlamına gelmez ve teşkil etmez. Kullanım Şartları'nda daha fazlasını okuyun.
Feragatname
Bilgiler ve yayınlar, TradingView tarafından sağlanan veya onaylanan finansal, yatırım, işlem veya diğer türden tavsiye veya tavsiyeler anlamına gelmez ve teşkil etmez. Kullanım Şartları'nda daha fazlasını okuyun.