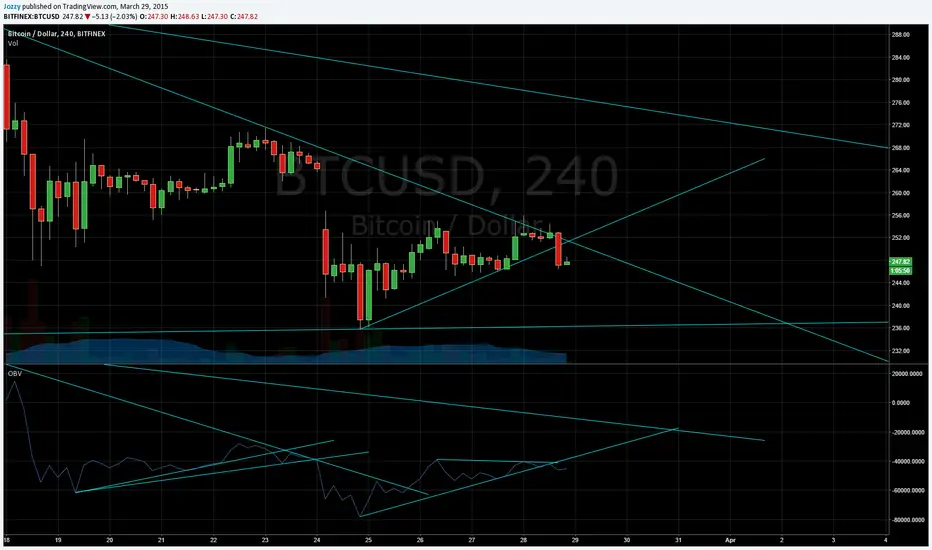
Here we can see a false breakout on the bearish trend we have been holding since March 16th. This was observable on OBV on a bearish volume divergence, the lower is lower on a higher high for price. This broke down after reaching the end of the the lower bullish OBV trendline and accelerated when it broke the same trend but on price support.
With this break down, I would expect a double bottom on horizontal price support at 236 - 237 USD.
With this break down, I would expect a double bottom on horizontal price support at 236 - 237 USD.
Feragatname
Bilgiler ve yayınlar, TradingView tarafından sağlanan veya onaylanan finansal, yatırım, işlem veya diğer türden tavsiye veya tavsiyeler anlamına gelmez ve teşkil etmez. Kullanım Şartları'nda daha fazlasını okuyun.
Feragatname
Bilgiler ve yayınlar, TradingView tarafından sağlanan veya onaylanan finansal, yatırım, işlem veya diğer türden tavsiye veya tavsiyeler anlamına gelmez ve teşkil etmez. Kullanım Şartları'nda daha fazlasını okuyun.