Current Setup Analysis
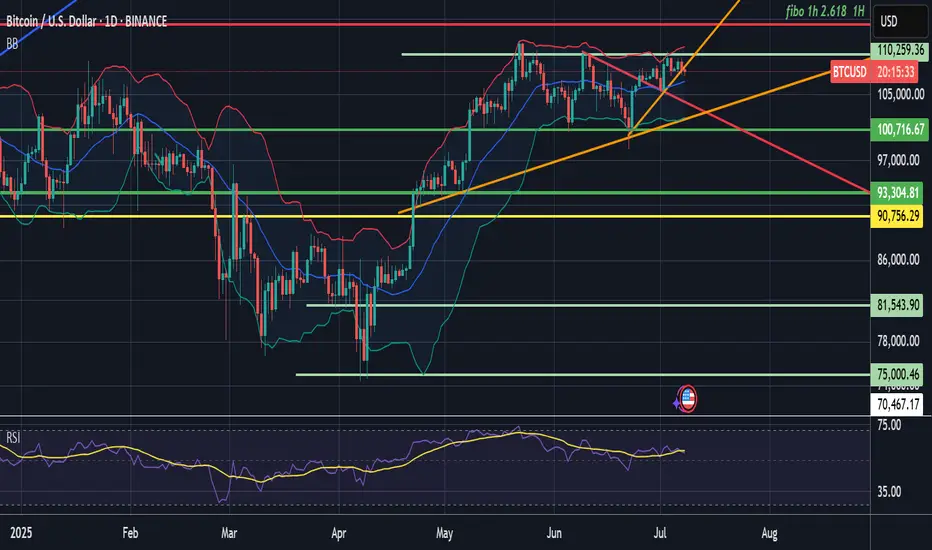
BTC broke out of a falling wedge pattern (red trendline) and is holding above support near $100K.
Higher lows since June indicate bullish accumulation.
The price is riding above the ascending orange trendline.
Bollinger Bands suggest potential continuation; RSI isn’t overbought.
▶️ Buy Setup (Long Bias)
Entry (Buy): Between 107,500–108,000
Stop Loss: Below 104,000 (just under trendline and BB midline)
Target 1: 110,259 (key horizontal + BB upper area)
Target 2: 112,000 (psychological resistance)
Target 3: 114,266–116,000 (Fibo 2.618 + extension zone)
Sell Setup (Short Bias) – only if rejection
Entry (Sell): If there's a clear rejection candle near 110,000–112,000
Stop Loss: Above 114,500
Target 1: 100,716
Target 2: 93,304
This is a low-probability setup unless rejection is clear.
Final Recommendation
High probability of bullish continuation (above 60%)
Prefer a buy-the-dip strategy with stop under $104K
Watch 110K area — could act as a breakout or rejection point
İşlem aktif
İşlem kapandı: durdurma seviyesi
Target 2: 112,000 Feragatname
Bilgiler ve yayınlar, TradingView tarafından sağlanan veya onaylanan finansal, yatırım, işlem veya diğer türden tavsiye veya tavsiyeler anlamına gelmez ve teşkil etmez. Kullanım Şartları'nda daha fazlasını okuyun.
Feragatname
Bilgiler ve yayınlar, TradingView tarafından sağlanan veya onaylanan finansal, yatırım, işlem veya diğer türden tavsiye veya tavsiyeler anlamına gelmez ve teşkil etmez. Kullanım Şartları'nda daha fazlasını okuyun.