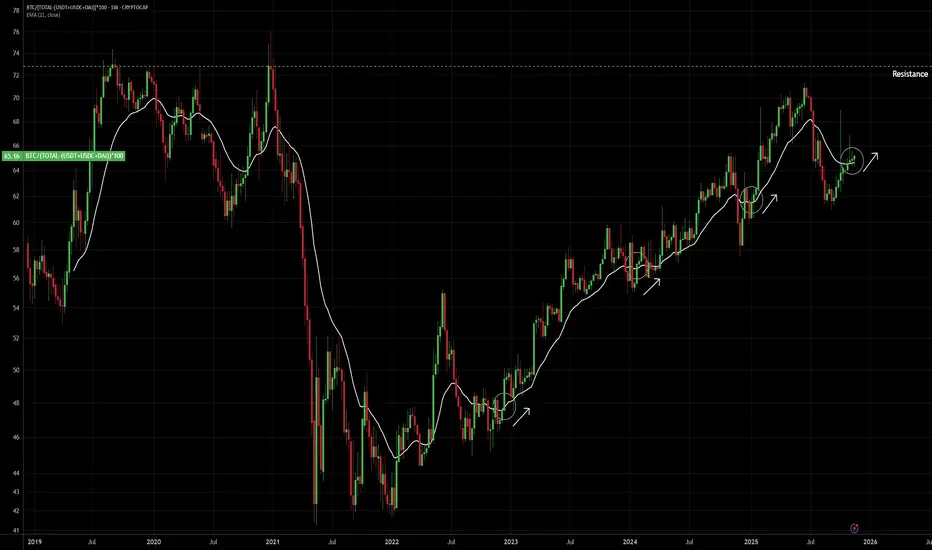
This is real BTC Dominance Chart By subtracting Mcap of major stablecoins like USDT, USDC and DAI.
The major misconception that has gripped the crypto market is the gross BTC Dominance.
From 2022, there has been an enormous amount of stablecoin creation by multiple US firms. The Stablecoins are not just used in purchase of crypto assets, but also used in holding real dollar currency in several countries whose national currency is in trouble. Even the Black economy is slowly transitioning from Cash business to USD stables.
The Real BTC Dominance should be a parameter of BTC market cap divided by the total Actual mcap of ETh and all other coins and tokens. That is how we used to judge the BTC dominance prior to 2020 (in 2020 the stablecoin economy was very small and almost entirely used for buying crypto assets only). Since today the USD stablecoin economy is increased enormously, we need to subtract the market cap of the stablecoins to get the real BTC dominance.
In this chart, we have subtracted the 3 major stablecoins USDT, USDC, DAI. There are many other stablecoins that are not taken into account because the newer Stablecoins will limit the Chart from 2023 onwards thus hampering the ability to see chart before 2020.
This chart is clearly bullish and currently above 21 week EMA.
Feragatname
Bilgiler ve yayınlar, TradingView tarafından sağlanan veya onaylanan finansal, yatırım, alım satım veya diğer türden tavsiye veya öneriler anlamına gelmez ve teşkil etmez. Kullanım Koşulları bölümünde daha fazlasını okuyun.
Feragatname
Bilgiler ve yayınlar, TradingView tarafından sağlanan veya onaylanan finansal, yatırım, alım satım veya diğer türden tavsiye veya öneriler anlamına gelmez ve teşkil etmez. Kullanım Koşulları bölümünde daha fazlasını okuyun.