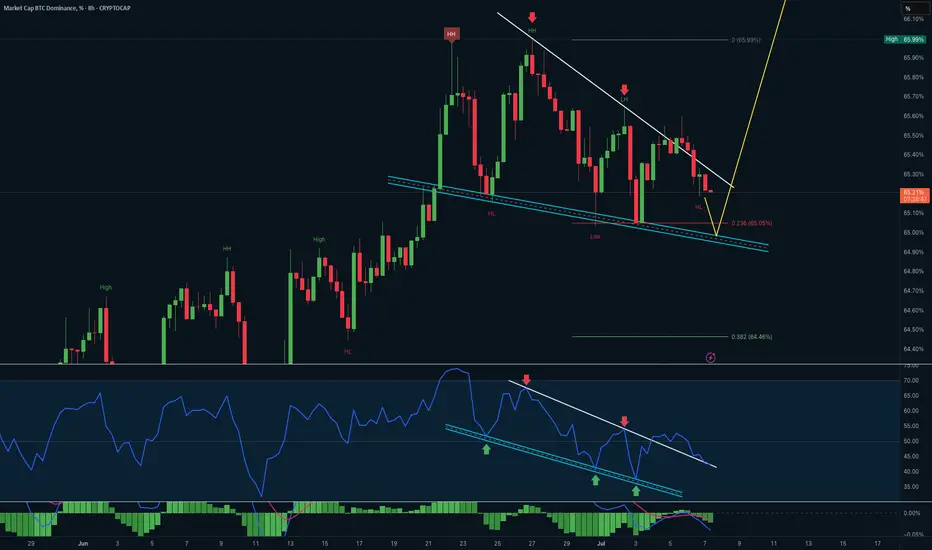
This 8H BTC.D chart is showing signs of a potential bullish reversal setup within a falling wedge, supported by RSI channel divergence and MACD structure.
Price Action:
• BTC.D is compressing within a falling wedge, marked by lower highs and higher lows.
• Price is currently near the lower boundary of the wedge, with confluence at the 0.236 Fibonacci level (65.05%) and historical HL zone.
• A break above the wedge resistance would signal trend reversal or continuation toward 66% - 67%.
RSI Momentum:
• RSI mirrors price by forming a descending channel, with multiple bullish bounces at lower support.
• Repeated touches on the lower band suggest momentum divergence building from oversold conditions.
• A break of RSI’s trendline would confirm bullish shift ahead of price breakout.
MACD Histogram:
• Flattening after bearish pressure, signaling that sellers may be losing momentum.
• Watch for cross up to accompany price breakout for stronger confirmation.
📌 Key Takeaways:
• Bullish reversal potential building within wedge
• RSI showing leading divergence from price
• Break above 65.5% zone could trigger a move to 66.0%–66.3%
• Breakdown of wedge invalidates the structure → next support: 64.46%
Feragatname
Bilgiler ve yayınlar, TradingView tarafından sağlanan veya onaylanan finansal, yatırım, alım satım veya diğer türden tavsiye veya öneriler anlamına gelmez ve teşkil etmez. Kullanım Koşulları bölümünde daha fazlasını okuyun.
Feragatname
Bilgiler ve yayınlar, TradingView tarafından sağlanan veya onaylanan finansal, yatırım, alım satım veya diğer türden tavsiye veya öneriler anlamına gelmez ve teşkil etmez. Kullanım Koşulları bölümünde daha fazlasını okuyun.