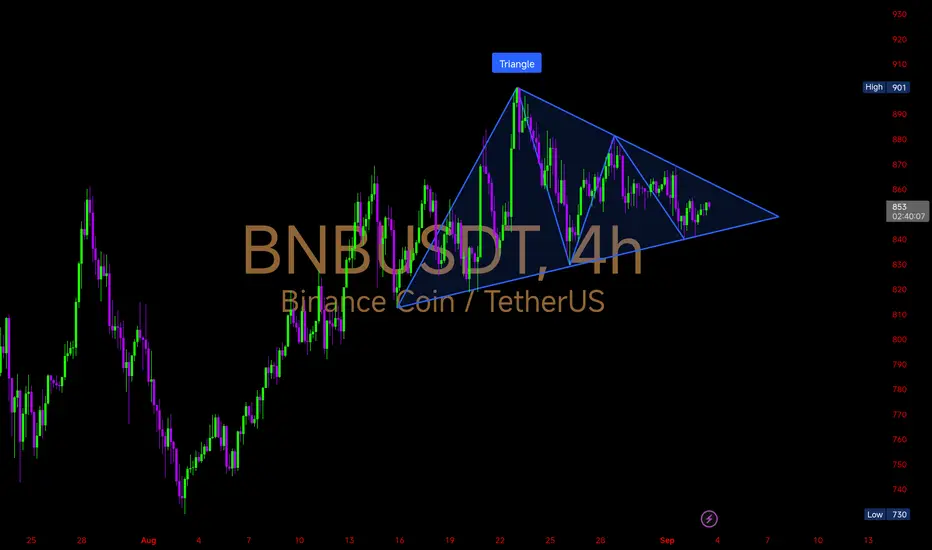
Price is consolidating inside a symmetrical triangle after the strong rally toward $901. This pattern signals a big breakout move ahead.
Key Levels
Upside Breakout Zone: $865 → $880 → $900
Downside Support Zone: $845 → $830 → $800
🔹A breakout above $865 could ignite momentum towards $900+, confirming trend continuation.
🔸 If price falls below $845, we may see a correction toward $820–800 before any recovery.
#BNB is coiling tighter. Expect volatility soon — whichever side breaks first will set the direction.
Feragatname
Bilgiler ve yayınlar, TradingView tarafından sağlanan veya onaylanan finansal, yatırım, işlem veya diğer türden tavsiye veya tavsiyeler anlamına gelmez ve teşkil etmez. Kullanım Şartları'nda daha fazlasını okuyun.
Feragatname
Bilgiler ve yayınlar, TradingView tarafından sağlanan veya onaylanan finansal, yatırım, işlem veya diğer türden tavsiye veya tavsiyeler anlamına gelmez ve teşkil etmez. Kullanım Şartları'nda daha fazlasını okuyun.