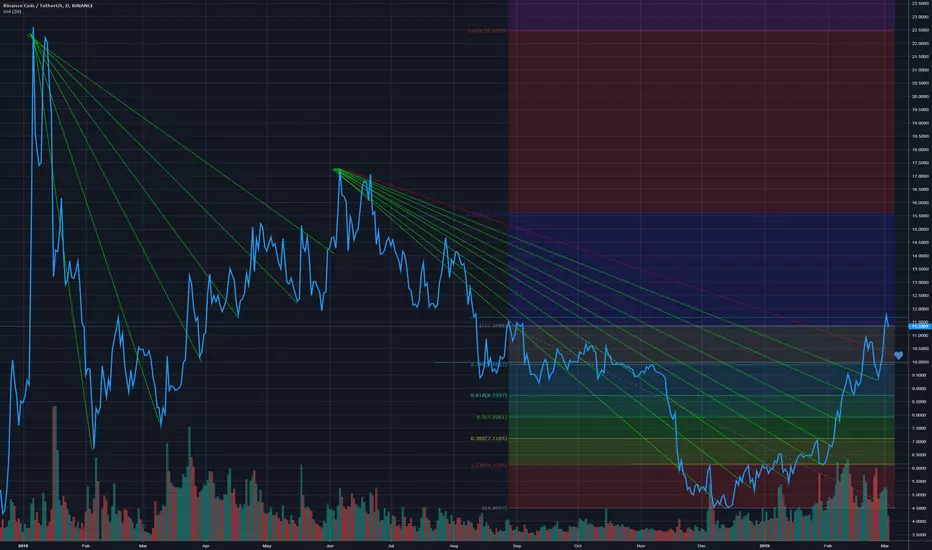
- Volumes are not enough to break the previous resistance, that's why in the past three days we have seen two strong resistances at 11.6$ which were not broken.
- If you look at green candlestick (1D timeframe), you will see that always, after 4/5 candlesticks the price recorrects itself by dropping. We are now at 4th.
- By looking at the green lines on the graphs, the uptrend follows a logic, which suggests a drop
- The main trend-line is almost in the "blu zone" with Fibonacci.
For these reasons I do not think it will go up now, but will drop and reach the heart point (about 10.5$), to recover after some day.
Be carefull guys.
Feragatname
Bilgiler ve yayınlar, TradingView tarafından sağlanan veya onaylanan finansal, yatırım, alım satım veya diğer türden tavsiye veya öneriler anlamına gelmez ve teşkil etmez. Kullanım Koşulları bölümünde daha fazlasını okuyun.
Feragatname
Bilgiler ve yayınlar, TradingView tarafından sağlanan veya onaylanan finansal, yatırım, alım satım veya diğer türden tavsiye veya öneriler anlamına gelmez ve teşkil etmez. Kullanım Koşulları bölümünde daha fazlasını okuyun.