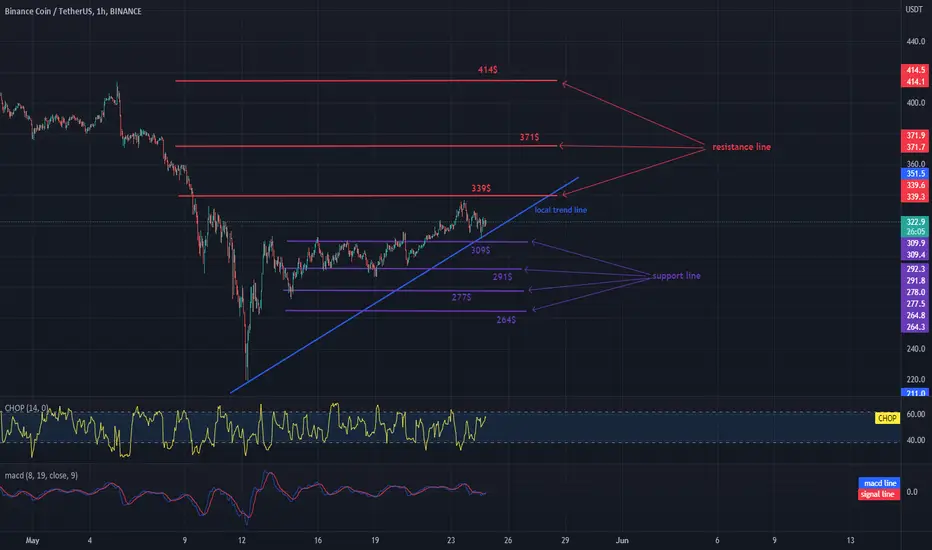
Hello everyone, let's take a look at the BNB to USDT chart on a 1 hour timeframe. As you can see, price is moving above the local uptrend line.
Let's start with the designation of the support line and as you can see the first support in the near future is $ 309, if the support breaks down, the next one is $ 291 and $ 277 and $ 264.
Now let's move from the resistance line as you can see the first resistance is $ 339, if you can break it the next resistance will be $ 371 and $ 414.
Looking at the CHOP indicator, we can see that there is a lot of energy in the 1 hour interval, and the MACD indicator shows that we are in a local uptrend.
Feragatname
Bilgiler ve yayınlar, TradingView tarafından sağlanan veya onaylanan finansal, yatırım, işlem veya diğer türden tavsiye veya tavsiyeler anlamına gelmez ve teşkil etmez. Kullanım Şartları'nda daha fazlasını okuyun.
Feragatname
Bilgiler ve yayınlar, TradingView tarafından sağlanan veya onaylanan finansal, yatırım, işlem veya diğer türden tavsiye veya tavsiyeler anlamına gelmez ve teşkil etmez. Kullanım Şartları'nda daha fazlasını okuyun.