I wasn’t able to post my analysis on TradingView last week, so here’s a structured summary of my ticker reviews from Oct 6–10, segmented by sector with brief commentary. Each includes an update on trend structure and a link to both the original chart and the latest revision as of Friday’s close.
Technology
 AMD – Clean follow-through off mid-term support into the upper band of resistance. Strong rejection increases the odds that a mid-term top for the uptrend since April is being formed. Any lower-high formation next week should be approached with caution.
Chart:

Previously:
• Upside potential to resistance (Oct 7):

• Downside potential:
• On resistance & bounce potential (Aug 6):
• On macro resistance (Jul 29):
• On macro bottoming potential (Apr):
 NVTS – Followed the Aug–Sep setup and delivered a strong breakout Friday, but late-day reversal increases the odds of a longer consolidation into 7.80–6.80 support.
Chart:

Previously:
• Breakout and local support (Oct 10):
• Consolidation and upside potential (Sep 30):
• Higher-low potential (Sep 26):
• Mid-term support (Aug 25): tradingview.com/symbols/NASDAQ-NVTS/minds/?mind=TG-GkbRtRaGErSPSXMYcRg
 MRVL – Reached the key mid-term resistance zone outlined earlier. Friday’s rejection increases odds of a pullback into 80–72 support over the coming weeks.
Chart:

Previously:
• On mid-term top (Oct 10):
• On resistance zone (Oct 2): tradingview.com/symbols/NASDAQ-MRVL/minds/?mind=BTOV58OwQAS_gh52-D_Kvg
 WDC – Orderly follow-through to the downside into the 21 EMA.
Chart:

Previously: downside potential to 21 EMA –
 RBLX – Rejected at local resistance, aligning with the downside structure.
Chart:

Previously: downside potential (Oct 8):
 REKR – Shows strong relative strength with steady consolidation at support; constructive base-building continues.
Chart:

Previously: follow-through and support (Oct 7):
 AI – Friday breakout attempt faded back into support, increasing odds of prolonged base-building and a potential deeper pullback to 17–16.
Chart:
Previously:
On continuation potential (Oct 8):
 BB – Failed on immediate continuation and returned to support.
Chart:
Previously:
On continuation potential (Oct 8):
 OPEN – Constructive consolidation stalled as failed breakouts shifted odds toward a deeper pullback into mid-term support.
Chart:
⸻
Blockchain
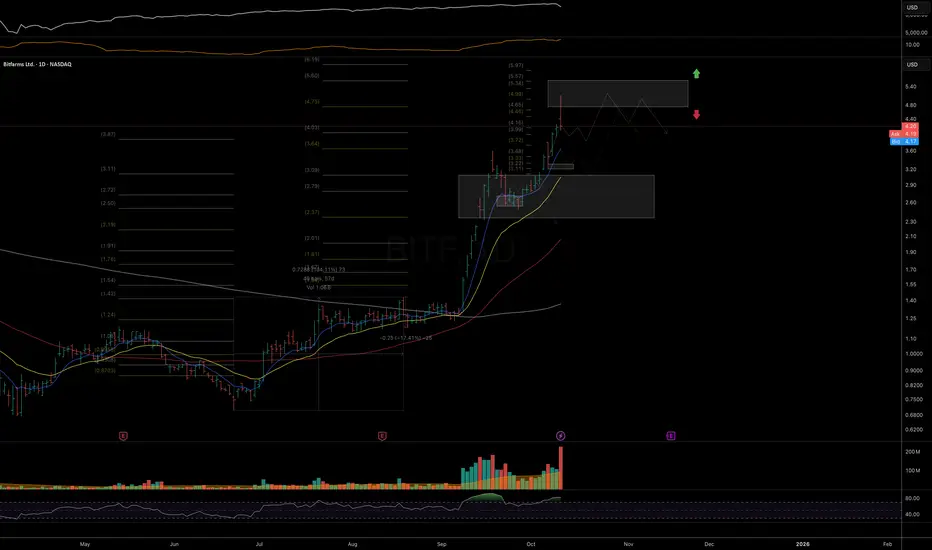
 BITF – Tagged the ideal macro resistance zone; odds rise for at least a mid-term top/base formation here.
Chart:

Previously:
On upside continuation (Oct 7):
 HIVE – Rejection at the top of mid-term resistance; probabilities favor the start of a reversal phase.
Chart:

Previously:
On macro resistance (Oct 6):
On more immediate upside potential (Sep 24): tradingview.com/symbols/NASDAQ-HIVE/minds/?mind=Vd571diiT1u3xVGH1kGhKw
•On bullish potential (Sep 10): tradingview.com/symbols/NASDAQ-HIVE/minds/?mind=UqHPKBdtQzCEipcKminPNQ
• On bullish trend structure (Jul 21): tradingview.com/symbols/NASDAQ-HIVE/minds/?mind=Y4zxqZwzRtyaDD8lmywGhw
 BKKT – No follow-through on continuation setup, but key local support still holds; structure remains intact while above it.
Chart:

Previously:
On continuation (Oct 9):
 BULL – Rotating back toward macro support near 11; monitoring for higher-low formation and reversal trigger.
Chart:

Previously:
On reversal and macro support (Oct 8):
On immediate bullish potential (Sep 26): tradingview.com/symbols/NASDAQ-BULL/minds/?mind=GqGeyQoBR6SKSPusscGaaA
• On macro support (Sep 19): tradingview.com/symbols/NASDAQ-BULL/minds/?mind=1zpzfLwhSNyk5xrc_bXRBg
• On macro support (Sep 4): tradingview.com/symbols/NASDAQ-BULL/minds/?mind=6lTB3WHIQAiRNPeDukZ1Wg&exchange=NASDAQ
• On mid-term resistance (Aug 6): tradingview.com/symbols/NASDAQ-BULL/minds/?mind=7SfNQ0fPQY2Zet6MU4KB6g&exchange=NASDAQ
• On support and bounce potential (Jul 30): tradingview.com/symbols/NASDAQ-BULL/minds/?mind=XQmtVEynRcu7Pye2Rw0E9Q&exchange=NASDAQ
 BTM – Bullish setup invalidated by breakdown into mid-term support.
Chart:

Previously:
On bullish follow-through if LOD holds (Oct 6):
⸻
Biotechnology / Healthcare
 VKTX – Strong follow-through from September update; watching for consolidation back into key EMAs to reset momentum.
Chart:

Previously:
On follow-through (Oct 6):
• On break-out potential (Sep 30): tradingview.com/symbols/NASDAQ-VKTX/minds/?mind=RyuxrFPaTMyJkFMZLAfOoQ
• On resistance zone (Aug 11): tradingview.com/symbols/NASDAQ-VKTX/minds/?mind=VLFAH1asTO2WJt4Y-TgXyw
• On upside momentum continuation (Jul 18): tradingview.com/symbols/NASDAQ-VKTX/minds/?mind=4owGJV5ZQaO33WP1hAviSg
• Original setup (Jun 30): tradingview.com/symbols/NASDAQ-VKTX/minds/?mind=Ug0UI_DXRAu5b95LGXIyog
• Follow-up (Jul 8): tradingview.com/symbols/NASDAQ-VKTX/minds/?mind=fZQV2wcyRL2hB7nariJikg
 NTLA – Clean follow-through into mid-term resistance; rising odds for a topping/base formation.
Chart:

Previously:
On break-out to resistance zone (Oct 8):
On support and bullish trend-structure (Sep 26): tradingview.com/symbols/NASDAQ-NTLA/minds/?mind=B8f6LFmoSxGopGgzEMnUPQ
 PGEN – Couldn’t stage a recovery yet but remains within mid-term support; stabilization needed for a constructive setup.
Chart:

Previously:
On potential reversal (Oct 8):
On mid-term support (Sep 15): tradingview.com/symbols/NASDAQ-PGEN/minds/?mind=Wd5W0WZ3R-qeB9zVjFAHHw
 ABCL – Momentum attempt resumed but failed to follow-through; still constructive above 21 EMA.
Chart:

Previously:
On local support and continuation potential (Oct 8):
On support and bullish trend-structure (Oct 7):
⸻
Energy
 GTE – Impulsive advance at risk of morphing into a diagonal correction; elevated probability of retesting September higher lows.
Chart:

Previously:
On constructive looking consolidation (Oct 6):

⸻
Miscellaneous / Other
 SLDP – Rising risk of a local top after Friday’s distribution; while above 21 EMA, a final push into resistance remains possible.
Chart:

Previously:
On follow-through and resistance zone (Oct 6):
On mid-term support and bullish potential (Sep 19): tradingview.com/symbols/NASDAQ-SLDP/minds/?mind=DStjOaOpSeGPWFwB-md_dA
 DPRO – Solid 2.5-day follow-through from the Oct update; Friday’s action suggests increased consolidation or reversal risk.
Chart:

Previously:
On local support and continuation (Oct 7):
 DLO – Disappointing fade after a promising start; must hold above 50-DMA to reassert upside momentum.
Chart:

Previously:
On break-out potential (Oct 8):
On pullback potential (Sep 22): tradingview.com/symbols/NASDAQ-DLO/minds/?mind=Zjk8an6VRFSLNP-Fdy3u7g
• On downside potential and support (Sep 3): tradingview.com/symbols/NASDAQ-DLO/minds/?mind=ceWeIiDKQ9-w4TabhWnsUw
Thank you for your attention and have a great start of the week!
Technology
Chart:
Previously:
• Upside potential to resistance (Oct 7):
• Downside potential:
• On resistance & bounce potential (Aug 6):
• On macro resistance (Jul 29):
• On macro bottoming potential (Apr):
Chart:
Previously:
• Breakout and local support (Oct 10):
• Consolidation and upside potential (Sep 30):
• Higher-low potential (Sep 26):
• Mid-term support (Aug 25): tradingview.com/symbols/NASDAQ-NVTS/minds/?mind=TG-GkbRtRaGErSPSXMYcRg
Chart:
Previously:
• On mid-term top (Oct 10):
• On resistance zone (Oct 2): tradingview.com/symbols/NASDAQ-MRVL/minds/?mind=BTOV58OwQAS_gh52-D_Kvg
Chart:
Previously: downside potential to 21 EMA –
Chart:
Previously: downside potential (Oct 8):
Chart:
Previously: follow-through and support (Oct 7):
Chart:
Previously:
On continuation potential (Oct 8):
Chart:
Previously:
On continuation potential (Oct 8):
Chart:
⸻
Blockchain
Chart:
Previously:
On upside continuation (Oct 7):
Chart:
Previously:
On macro resistance (Oct 6):
On more immediate upside potential (Sep 24): tradingview.com/symbols/NASDAQ-HIVE/minds/?mind=Vd571diiT1u3xVGH1kGhKw
•On bullish potential (Sep 10): tradingview.com/symbols/NASDAQ-HIVE/minds/?mind=UqHPKBdtQzCEipcKminPNQ
• On bullish trend structure (Jul 21): tradingview.com/symbols/NASDAQ-HIVE/minds/?mind=Y4zxqZwzRtyaDD8lmywGhw
Chart:
Previously:
On continuation (Oct 9):
Chart:
Previously:
On reversal and macro support (Oct 8):
On immediate bullish potential (Sep 26): tradingview.com/symbols/NASDAQ-BULL/minds/?mind=GqGeyQoBR6SKSPusscGaaA
• On macro support (Sep 19): tradingview.com/symbols/NASDAQ-BULL/minds/?mind=1zpzfLwhSNyk5xrc_bXRBg
• On macro support (Sep 4): tradingview.com/symbols/NASDAQ-BULL/minds/?mind=6lTB3WHIQAiRNPeDukZ1Wg&exchange=NASDAQ
• On mid-term resistance (Aug 6): tradingview.com/symbols/NASDAQ-BULL/minds/?mind=7SfNQ0fPQY2Zet6MU4KB6g&exchange=NASDAQ
• On support and bounce potential (Jul 30): tradingview.com/symbols/NASDAQ-BULL/minds/?mind=XQmtVEynRcu7Pye2Rw0E9Q&exchange=NASDAQ
Chart:
Previously:
On bullish follow-through if LOD holds (Oct 6):
⸻
Biotechnology / Healthcare
Chart:
Previously:
On follow-through (Oct 6):
• On break-out potential (Sep 30): tradingview.com/symbols/NASDAQ-VKTX/minds/?mind=RyuxrFPaTMyJkFMZLAfOoQ
• On resistance zone (Aug 11): tradingview.com/symbols/NASDAQ-VKTX/minds/?mind=VLFAH1asTO2WJt4Y-TgXyw
• On upside momentum continuation (Jul 18): tradingview.com/symbols/NASDAQ-VKTX/minds/?mind=4owGJV5ZQaO33WP1hAviSg
• Original setup (Jun 30): tradingview.com/symbols/NASDAQ-VKTX/minds/?mind=Ug0UI_DXRAu5b95LGXIyog
• Follow-up (Jul 8): tradingview.com/symbols/NASDAQ-VKTX/minds/?mind=fZQV2wcyRL2hB7nariJikg
Chart:
Previously:
On break-out to resistance zone (Oct 8):
On support and bullish trend-structure (Sep 26): tradingview.com/symbols/NASDAQ-NTLA/minds/?mind=B8f6LFmoSxGopGgzEMnUPQ
Chart:
Previously:
On potential reversal (Oct 8):
On mid-term support (Sep 15): tradingview.com/symbols/NASDAQ-PGEN/minds/?mind=Wd5W0WZ3R-qeB9zVjFAHHw
Chart:
Previously:
On local support and continuation potential (Oct 8):
On support and bullish trend-structure (Oct 7):
⸻
Energy
Chart:
Previously:
On constructive looking consolidation (Oct 6):
⸻
Miscellaneous / Other
Chart:
Previously:
On follow-through and resistance zone (Oct 6):
On mid-term support and bullish potential (Sep 19): tradingview.com/symbols/NASDAQ-SLDP/minds/?mind=DStjOaOpSeGPWFwB-md_dA
Chart:
Previously:
On local support and continuation (Oct 7):
Chart:
Previously:
On break-out potential (Oct 8):
On pullback potential (Sep 22): tradingview.com/symbols/NASDAQ-DLO/minds/?mind=Zjk8an6VRFSLNP-Fdy3u7g
• On downside potential and support (Sep 3): tradingview.com/symbols/NASDAQ-DLO/minds/?mind=ceWeIiDKQ9-w4TabhWnsUw
Thank you for your attention and have a great start of the week!
📊 Daily FREE Market Insights | Crypto + US Stocks
⚡ Technical analysis, setups & commentary
🌍 t.me/MarketArtistryENG | 🇷🇺 t.me/marketartistry
Join and let's grow together! 🚀
⚡ Technical analysis, setups & commentary
🌍 t.me/MarketArtistryENG | 🇷🇺 t.me/marketartistry
Join and let's grow together! 🚀
Feragatname
Bilgiler ve yayınlar, TradingView tarafından sağlanan veya onaylanan finansal, yatırım, işlem veya diğer türden tavsiye veya tavsiyeler anlamına gelmez ve teşkil etmez. Kullanım Şartları'nda daha fazlasını okuyun.