Step-by-Step Analysis
1. Monthly Timeframe Analysis
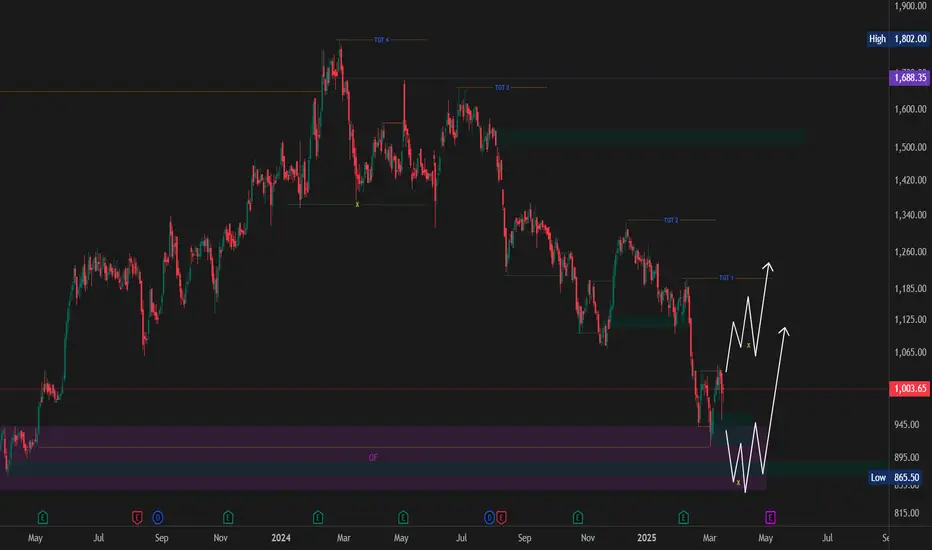
📌 Previous Monthly Swing High: ₹1,650 (Liquidity Taken)
📌 Current Market High: ₹1,802
📌 Key Swing Low: ₹1,060.55
📌 Accumulation Zone: ₹943 – ₹846
✅ The price has now reached this accumulation range, making it a potential long-term buying opportunity.
2. Daily Timeframe Confirmation
✅ The daily chart shows a liquidity sweep and a structure shift, supporting a potential reversal.
✅ While the price is in the monthly buying zone, we still need additional confirmation before committing to a full position.
✅ Key Entry Levels for Investors:
₹960 – ₹915: First zone to accumulate small quantities.
₹889 – ₹865: If the market dips further, this range offers a strong investment opportunity.
3. Profit Targets & Risk Management
📈 Profit Targets:
1️⃣ ₹1,215 – First target (short-term)
2️⃣ ₹1,330 – Second target (mid-term)
3️⃣ ₹1,657 – ₹1,800+ – Major long-term targets
📉 Stop-Loss Strategy:
Set your stop-loss based on risk tolerance.
Conservative traders can place stop-loss near ₹750 – ₹730, ensuring a good risk-reward ratio.
Investment Strategy
🔹 Scenario 1: If price confirms reversal in the daily timeframe, early accumulation between ₹960 – ₹915 can be done.
🔹 Scenario 2: If price drops further below ₹910, investors can accumulate between ₹889 – ₹865.
🔹 Scenario 3: If price fails to hold these levels, wait for confirmation before further investment.
Final Thoughts
📊 This analysis is based on Smart Money Concepts (SMC) and liquidity-based trading strategies. While the accumulation zone is active, additional confirmation is recommended. Always conduct your own research and consult with financial experts before making an investment decision.
💡 Key Takeaway: Birla Corporation is at a potential investment-worthy level, but confirmation is crucial before committing large capital.
👉 Would you like a TradingView chart with this analysis? Let me know! 🚀https://www.tradingview.com/x/QAbmdoep/
1. Monthly Timeframe Analysis
📌 Previous Monthly Swing High: ₹1,650 (Liquidity Taken)
📌 Current Market High: ₹1,802
📌 Key Swing Low: ₹1,060.55
📌 Accumulation Zone: ₹943 – ₹846
✅ The price has now reached this accumulation range, making it a potential long-term buying opportunity.
2. Daily Timeframe Confirmation
✅ The daily chart shows a liquidity sweep and a structure shift, supporting a potential reversal.
✅ While the price is in the monthly buying zone, we still need additional confirmation before committing to a full position.
✅ Key Entry Levels for Investors:
₹960 – ₹915: First zone to accumulate small quantities.
₹889 – ₹865: If the market dips further, this range offers a strong investment opportunity.
3. Profit Targets & Risk Management
📈 Profit Targets:
1️⃣ ₹1,215 – First target (short-term)
2️⃣ ₹1,330 – Second target (mid-term)
3️⃣ ₹1,657 – ₹1,800+ – Major long-term targets
📉 Stop-Loss Strategy:
Set your stop-loss based on risk tolerance.
Conservative traders can place stop-loss near ₹750 – ₹730, ensuring a good risk-reward ratio.
Investment Strategy
🔹 Scenario 1: If price confirms reversal in the daily timeframe, early accumulation between ₹960 – ₹915 can be done.
🔹 Scenario 2: If price drops further below ₹910, investors can accumulate between ₹889 – ₹865.
🔹 Scenario 3: If price fails to hold these levels, wait for confirmation before further investment.
Final Thoughts
📊 This analysis is based on Smart Money Concepts (SMC) and liquidity-based trading strategies. While the accumulation zone is active, additional confirmation is recommended. Always conduct your own research and consult with financial experts before making an investment decision.
💡 Key Takeaway: Birla Corporation is at a potential investment-worthy level, but confirmation is crucial before committing large capital.
👉 Would you like a TradingView chart with this analysis? Let me know! 🚀https://www.tradingview.com/x/QAbmdoep/
İşlem aktif
Birla Corporation – Breakout Awaited for Next Big Move 🚀📊 Recap & Current Market Position
We previously analyzed Birla Corporation on March 17, 2025, highlighting a potential upside move. As expected, after our post, the price surged and made a high of ₹1,114 on March 25, 2025.
Currently, the stock is trading within a range of ₹1,045 – ₹1,114 over the last 5 trading sessions, indicating a consolidation phase.
📌 Key Observations & Market Structure
✅ Price Action: Consolidating between ₹1,045 – ₹1,114
✅ Breakout Potential: If price breaks above ₹1,114, we can expect a strong bullish move
✅ Smart Money Concepts (SMC): Liquidity is being built within this range, making it a crucial zone for the next directional move
📈 Profit Targets & Trading Strategy
📌 If the breakout happens above ₹1,114, we can expect a strong move towards the following levels:
📊 Profit Targets:
1️⃣ ₹1,215 – Short-term target
2️⃣ ₹1,330 – Mid-term target
3️⃣ ₹1,657 – ₹1,800+ – Long-term target
📉 Stop-Loss Strategy:
🔹 For Breakout Traders: Below ₹1,045 (Range Breakdown)
🔹 For Conservative Traders: Below ₹1,000 to minimize risk
🚀 Trading Plan & Final Thoughts
📌 Scenario 1: If the price breaks above ₹1,114, initiate a buy trade for a strong breakout move.
📌 Scenario 2: If price retraces to ₹1,045 without breaking down, this could act as a buying zone for a better entry.
📌 Scenario 3: If price breaks below ₹1,045, wait for a new structure before entering.
📢 Don't Miss Out!
✅ Follow me for more stock market insights!
👍 Drop a like if you found this helpful!
💬 Comment your views – Do you think a breakout is coming? Let’s discuss!
🚀 Stay tuned for the next move! 💹
Feragatname
Bilgiler ve yayınlar, TradingView tarafından sağlanan veya onaylanan finansal, yatırım, işlem veya diğer türden tavsiye veya tavsiyeler anlamına gelmez ve teşkil etmez. Kullanım Şartları'nda daha fazlasını okuyun.
Feragatname
Bilgiler ve yayınlar, TradingView tarafından sağlanan veya onaylanan finansal, yatırım, işlem veya diğer türden tavsiye veya tavsiyeler anlamına gelmez ve teşkil etmez. Kullanım Şartları'nda daha fazlasını okuyun.