📉 1-Hour Technical Analysis Summary
Overall Signal: Strong Sell
Relative Strength Index (RSI): 41.43 — approaching oversold territory
MACD: -0.58 — indicating downward momentum
Stochastic Oscillator: 21.78 — confirming bearish bias
Average Directional Index (ADX): 54.36 — suggesting a strong trend
Williams %R: -76.66 — indicating oversold conditions
Commodity Channel Index (CCI): -68.24 — supporting bearish outlook
Pivot Levels:
Support: S1 = ₹238.45
Resistance: R1 = ₹240.85
These indicators collectively suggest a continuation of the current downtrend.
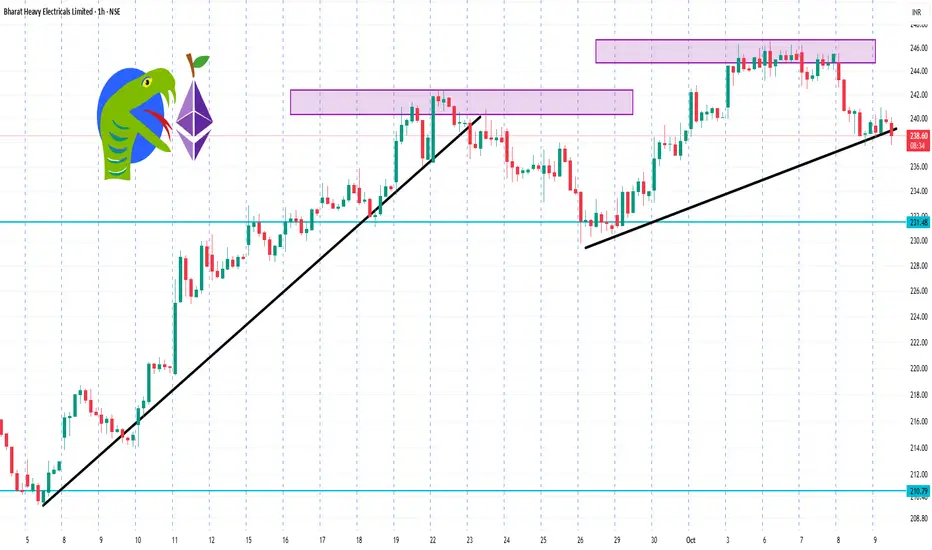
🔍 Key Price Levels
Intraday Support: ₹236.19
Intraday Resistance: ₹243.64
Overall Signal: Strong Sell
Relative Strength Index (RSI): 41.43 — approaching oversold territory
MACD: -0.58 — indicating downward momentum
Stochastic Oscillator: 21.78 — confirming bearish bias
Average Directional Index (ADX): 54.36 — suggesting a strong trend
Williams %R: -76.66 — indicating oversold conditions
Commodity Channel Index (CCI): -68.24 — supporting bearish outlook
Pivot Levels:
Support: S1 = ₹238.45
Resistance: R1 = ₹240.85
These indicators collectively suggest a continuation of the current downtrend.
🔍 Key Price Levels
Intraday Support: ₹236.19
Intraday Resistance: ₹243.64
İlgili yayınlar
Feragatname
Bilgiler ve yayınlar, TradingView tarafından sağlanan veya onaylanan finansal, yatırım, işlem veya diğer türden tavsiye veya tavsiyeler anlamına gelmez ve teşkil etmez. Kullanım Şartları'nda daha fazlasını okuyun.
İlgili yayınlar
Feragatname
Bilgiler ve yayınlar, TradingView tarafından sağlanan veya onaylanan finansal, yatırım, işlem veya diğer türden tavsiye veya tavsiyeler anlamına gelmez ve teşkil etmez. Kullanım Şartları'nda daha fazlasını okuyun.