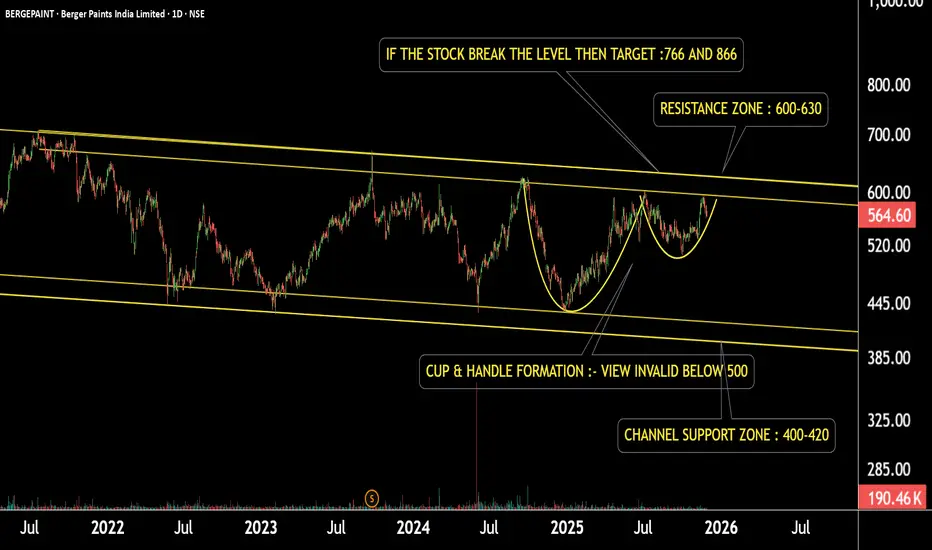
This is the daily timeframe chart of Berger Paint.
The stock is moving within a well-defined channel and has formed a Cup & Handle pattern inside the structure.
If the pattern continues to hold and the price stays above ₹500, the pattern remains valid.
A breakout above the resistance may trigger potential upside targets of ₹766 and ₹866.
However, if the price fails and breaks below this zone, the stock may decline toward the channel support near ₹400.
Thank you.
@RahulSaraoge
Connect us at t.me/stridesadvisory
Connect us at t.me/stridesadvisory
Feragatname
Bilgiler ve yayınlar, TradingView tarafından sağlanan veya onaylanan finansal, yatırım, alım satım veya diğer türden tavsiye veya öneriler anlamına gelmez ve teşkil etmez. Kullanım Koşulları bölümünde daha fazlasını okuyun.