Price Action Analysis:
Current Price Movement:
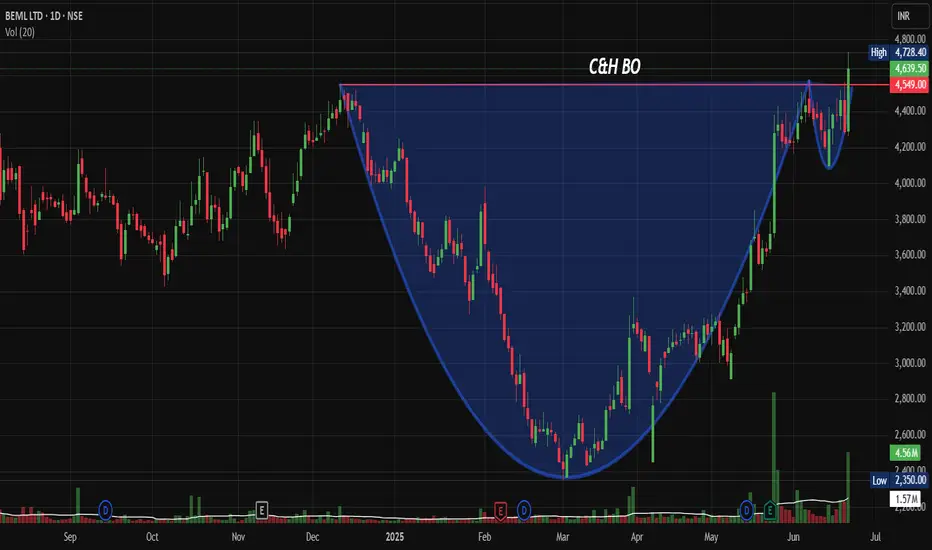
-Current Price: ₹4,291.50 (as of June 20, 2025)
-Daily Change: +₹351.70 (+8.20%) - Strong bullish momentum
-High: ₹4,728.40 | Low: ₹4,261.00
-Opening: ₹4,291.50 | Volume: 1.57M shares
Key Price Action Points:
Phase 1: Initial Decline (Sep 2024 - Dec 2024)
-Price Range: 4,400 to 3,600 levels
-Characteristics: Controlled selling with no panic dumping
-Volume: Moderate selling pressure
-Significance: Formation of the cup's left rim
Phase 2: Deep Correction (Dec 2024 - Feb 2025)
-Price Range: 3,600 to 2,350 (Cup Bottom)
-Characteristics: Capitulation phase with heavy selling
-Volume: High volume during the decline indicates washout
-Key Level: 2,350 marked the absolute low and cup base
Phase 3: Recovery Rally (Feb 2025 - Apr 2025)
-Price Range: 2,350 to 3,400 levels
-Characteristics: Strong bounce from cup bottom with increasing volume
-Price Action: Higher lows formation indicating accumulation
-Recovery Strength: 45% bounce from lows
Phase 4: Handle Formation (Apr 2025 - May 2025)
-Price Range: 3,400 to 3,000 levels (shallow pullback)
-Characteristics: Light volume decline, healthy consolidation
-Duration: Approximately 4-6 weeks of sideways action
-Volume Pattern: Drying up volume during pullback - classic handle behaviour
Phase 5: Breakout Phase (May 2025 - Current)
-Breakout Level: Above 3,400-3,500 resistance
-Price Acceleration: From 3,000 to the current 4,639 levels
-Volume Confirmation: Massive volume surge during breakout
-Momentum: 43% rally from handle lows in just 6-8 weeks
Candlestick Patterns and Price Behaviour
-Recent Action: Large green candles with minimal upper shadows indicating strong buying pressure
-Volume-Price Relationship: Price advancing on expanding volume - healthy trend
-Pullback Quality: Any pullbacks have been shallow with quick recoveries
-Support Holding: Price consistently holding above key moving averages
Price Structure Analysis:
-Higher Highs: Consistent pattern of higher peaks since February 2025
-Higher Lows: Each pullback finds support at higher levels
-Trend Strength: Steep angle of ascent indicates strong institutional buying
-Momentum Characteristics: Price moving in strong trending phases rather than choppy action
Critical Price Levels Based on Price Action:
-Breakout Confirmation: 3,500 level successfully held as support after breakout
-Momentum Continuation: 4,000 psychological level cleared with ease
-Current Resistance Test: Approaching the 4,800 level with strong momentum
-Volume at Key Levels: Each significant level break is accompanied by volume expansion
Chart Patterns:
-Cup and Handle Formation: The chart displays a classic cup and handle pattern spanning from late 2024 to mid-2025, with the cup formation completing around June 2025 at approximately 4,639 levels
-Breakout Confirmation: Stock has successfully broken above the handle resistance levels with strong volume confirmation
-Time Frame: The pattern has developed over approximately 9 months, indicating strong institutional accumulation
Support and Resistance Levels:
Major Support Levels:
-Immediate Support: 4,000-4,100 (psychological and technical level)
-Primary Support: 3,800-3,900 (previous resistance turned support)
-Secondary Support: 3,400-3,500 (breakout level)
-Long-term Support: 2,800-3,000 (cup base formation)
Resistance Levels:
-Immediate Resistance: 4,800-4,900 (current test level)
-Major Resistance: 5,200-5,400 (projected target based on cup depth)
-Extended Target: 5,800-6,000 (long-term projection)
Volume Spread Analysis:
-Breakout Volume: Significant volume spike observed during the recent breakout from handle formation
-Volume Confirmation: Above-average volume during the entire cup formation phase indicates institutional interest
-Current Volume: 1.57M shares showing continued institutional participation
-Volume Trend: Consistent volume buildup supporting price advancement
Base Formation Analysis:
Primary Base Characteristics:
-Base Type: Cup and Handle pattern with 7-month consolidation
-Base Depth: Approximately 47% correction from highs of 4,400 to lows of 2,350
-Base Duration: Extended consolidation period allowing for proper shake-out of weak hands
-Base Quality: Clean consolidation with clear support and resistance levels
Trade Setup Analysis:
Entry Strategy:
-Primary Entry: 4,100-4,200 (on pullback to support zone)
-Aggressive Entry: Current market price around 4,300 with tight stop-loss
-Conservative Entry: Wait for retest of 3,800-4,000 support levels
Exit Levels:
Target 1: 5,200 (21% upside from current levels)
Target 2: 5,600 (30% upside potential)
Target 3: 6,000 (40% upside - long-term target)
Stop-Loss Management:
Initial Stop-Loss: 3,800 (below key support)
Trailing Stop: Move to 4,000 once Target 1 is achieved
Risk-Reward Ratio: 1:2.5 (favourable risk-reward setup)
Position Sizing Recommendations:
-Conservative Approach: 2-3% of portfolio allocation
-Moderate Risk: 3-5% allocation for growth-oriented portfolios
-Risk Management: Maximum 5% position size due to single stock concentration risk
Risk Management Framework:
Key Risk Factors:
Market Risk: Overall market volatility can impact individual stock performance
Sector Risk: Defence and infrastructure sector cyclicality
Execution Risk: Pattern failure if stock breaks below 3,800 support
Risk Mitigation Strategies:
Diversification: Avoid over-concentration in a single position
Stop-Loss Discipline: Strict adherence to predetermined exit levels
Position Monitoring: Regular review of technical and fundamental developments
Sectoral and Fundamental Backdrop:
Business Verticals:
-BEML operates across Defence, Rail, Power, Mining and Infrastructure sectors, serving India's core industries BemlindiaBemlindia
-The company manufactures heavy earthmoving equipment for mining and construction, defence vehicles, and coaches for metro and Indian Railways, Bharat Earth Movers Limited
Financial Performance:
-Market Cap: ₹19,324 Crore with revenue of ₹4,022 Cr and profit of ₹293 Cr
-Promoter holding stands at 54.0%, indicating strong government backing.
-The board has recommended a final dividend of ₹1.20 per share for FY25, reflecting confidence in financial performance.
Growth Drivers:
-Company targeting ₹30bn annual opportunity in the mining sector with state-of-the-art equipment.
-Defence projects, including DATRAN prototypes, are expected to be completed by mid-2025
-The company has grown from ₹5 Cr turnover in 1965 to over ₹4,300 Cr currently.
Sector Outlook:
-Defence Modernization: Beneficiary of India's defence modernization and Make in India initiatives
-Infrastructure Push: The Government's focus on infrastructure development supports mining and construction equipment demand
-Railway Expansion: Metro and railway coach manufacturing aligned with India's transportation infrastructure growth
Investment Thesis:
-PSU Re-rating: Part of the broader PSU re-rating theme in Indian markets
-Diversified Revenue: Multi-sector exposure provides revenue stability
-Government Support: Strong backing from the Ministry of Defence ensures policy support
-Technical Breakout: Pattern completion suggests an institutional accumulation phase
My Take:
The combination of strong price action momentum with improving fundamental backdrop makes BEML an attractive investment opportunity for medium to long-term investors, with the cup and handle breakout providing clear entry and exit parameters for risk management.
Keep in the Watchlist.
NO RECO. For Buy/Sell.
📌Thank you for exploring my idea! I hope you found it valuable.
🙏FOLLOW for more
👍BOOST if you found it useful.
✍️COMMENT below with your views.
Meanwhile, check out my other stock ideas on the right side until this trade is activated. I would love your feedback.
Disclaimer: "I am not a SEBI REGISTERED RESEARCH ANALYST AND INVESTMENT ADVISER."
This analysis is intended solely for informational and educational purposes and should not be interpreted as financial advice. It is advisable to consult a qualified financial advisor or conduct thorough research before making investment decisions.
İşlem aktif
Testing Immediate Resistance: 4,800-4,900 (current test level)İlgili yayınlar
Feragatname
Bilgiler ve yayınlar, TradingView tarafından sağlanan veya onaylanan finansal, yatırım, alım satım veya diğer türden tavsiye veya öneriler anlamına gelmez ve teşkil etmez. Kullanım Koşulları bölümünde daha fazlasını okuyun.
İlgili yayınlar
Feragatname
Bilgiler ve yayınlar, TradingView tarafından sağlanan veya onaylanan finansal, yatırım, alım satım veya diğer türden tavsiye veya öneriler anlamına gelmez ve teşkil etmez. Kullanım Koşulları bölümünde daha fazlasını okuyun.