📊 BANK NIFTY TRADING PLAN – 13th May 2025 (15-Min Chart-Based Strategy)
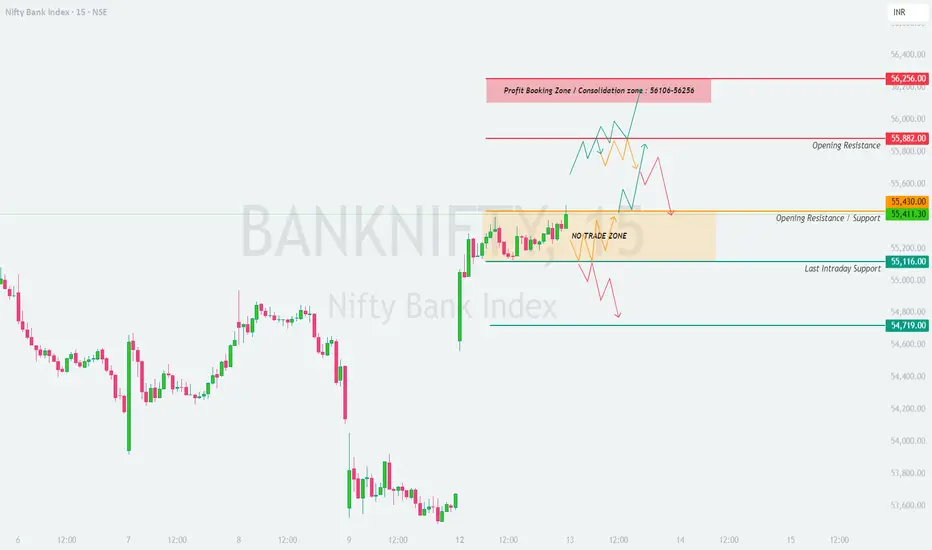
Bank Nifty closed at 55,411 on 12-May-2025. Price action has formed a tight range between 55,116 and 55,430, marking this as the “No Trade Zone” unless a breakout or breakdown is confirmed.
Let’s analyze each type of possible opening scenario for the next session:
🟢 SCENARIO 1: GAP-UP OPENING (Opening Above 55,611)
(200+ points gap-up from previous close)
A gap-up above the Opening Resistance level of 55,430 pushes price into the Profit Booking Zone – 56,106 to 56,256. This is a critical area that can either act as a supply zone or fuel a strong continuation.
👉 Tip: Don’t chase the gap-up. Let price confirm strength or weakness before entry. Watch volume near resistance zones.
🟨 SCENARIO 2: FLAT OPENING (Between 55,116 – 55,430)
(Open within previous close ±200 pts)
This region is now a NO TRADE ZONE due to low conviction and trapped volume from previous sessions.
👉 Tip: Let the first 15–30 minutes pass. Observe how price behaves near the edges of the “no trade zone” before committing.
🔻 SCENARIO 3: GAP-DOWN OPENING (Below 54,719)
(200+ points gap-down from previous close)
A gap-down below 54,719 puts pressure on bulls and may induce panic selling if the breakdown is supported by volume.
👉 Tip: Don’t trade emotionally after a gap-down. Use structure-based stop loss and manage risk tightly.
💡 OPTIONS TRADING – RISK MANAGEMENT TIPS:
📌 SUMMARY & CONCLUSION:
Key Levels:
🔸 Resistance Zone: 55,430 – 55,882
🔸 Profit Booking Zone: 56,106 – 56,256
🔸 Support Levels: 55,116 and 54,719
🔸 Breakout Zone: Above 55,611
🔸 Breakdown Zone: Below 54,719
🔸 NO TRADE ZONE: 55,116 – 55,430
This is a reaction-based market – wait for price to move out of tight consolidation and follow with proper structure. Use pre-marked zones to anticipate market behavior and don’t assume direction without confirmation.
Trade only if the plan aligns with live price action.
⚠️ DISCLAIMER:
I am not a SEBI-registered analyst. This trading plan is shared purely for educational purposes. Please consult your financial advisor before making any investment or trading decisions. Risk management and personal discretion are advised.
Bank Nifty closed at 55,411 on 12-May-2025. Price action has formed a tight range between 55,116 and 55,430, marking this as the “No Trade Zone” unless a breakout or breakdown is confirmed.
Let’s analyze each type of possible opening scenario for the next session:
🟢 SCENARIO 1: GAP-UP OPENING (Opening Above 55,611)
(200+ points gap-up from previous close)
A gap-up above the Opening Resistance level of 55,430 pushes price into the Profit Booking Zone – 56,106 to 56,256. This is a critical area that can either act as a supply zone or fuel a strong continuation.
- []Opening above 55,611 but within the 56,106–56,256 zone calls for caution. Avoid early entries; this is a potential reversal or profit-booking zone.
[]If Bank Nifty sustains above 56,256, one can consider a breakout trade toward 56,500+ with a tight SL below 56,100.
[]If rejection candles (like shooting star, bearish engulfing) form at the zone top, then a short trade may be initiated for targets near 55,882 – 55,430.
[]Best risk-reward trade setup: Wait for a retest of 55,882 (Opening Resistance). If support holds, enter long with SL below 55,800. - Aggressive shorting is only favorable if breakdown happens below 56,106 after failing at 56,256.
👉 Tip: Don’t chase the gap-up. Let price confirm strength or weakness before entry. Watch volume near resistance zones.
🟨 SCENARIO 2: FLAT OPENING (Between 55,116 – 55,430)
(Open within previous close ±200 pts)
This region is now a NO TRADE ZONE due to low conviction and trapped volume from previous sessions.
- []Avoid initiating trades inside 55,116 – 55,430 unless a breakout or breakdown is confirmed on a 15-min candle close with follow-through volume.
[]Bullish scenario activates above 55,430 – expect momentum toward 55,882, then 56,106.
[]Bearish setup triggers only if price breaks below 55,116; the next support lies at 54,719.
[]Within this range, wait for market structure (like higher highs/lows or breakdowns) to develop before acting. - Fakeouts are common in this range – always use SL based on structure.
👉 Tip: Let the first 15–30 minutes pass. Observe how price behaves near the edges of the “no trade zone” before committing.
🔻 SCENARIO 3: GAP-DOWN OPENING (Below 54,719)
(200+ points gap-down from previous close)
A gap-down below 54,719 puts pressure on bulls and may induce panic selling if the breakdown is supported by volume.
- []If a strong bullish reversal candle (like hammer or morning star) forms near 54,500–54,600, consider a quick long trade toward 55,116 with SL just below reversal low.
[]If price sustains below 54,719 and fails retest, one can look for a short trade with targets toward 54,300 – 54,000.
[]Avoid catching falling knives – let reversal patterns confirm before long entries.
[]Intraday bounce from oversold levels is possible but stay nimble and trail SL. - Watch for short-covering if market quickly reclaims 54,719 – this may offer sharp rallies.
👉 Tip: Don’t trade emotionally after a gap-down. Use structure-based stop loss and manage risk tightly.
💡 OPTIONS TRADING – RISK MANAGEMENT TIPS:
- []Trade near-the-money or slightly in-the-money options for better delta and lesser time decay.
[]Avoid buying far OTM options unless breakout/breakdown is very strong.
[]Always keep SL based on underlying levels, not premium alone.
[]Use a fixed % of your capital per trade (max 2–3% risk).
[]Don’t overtrade – wait for directional clarity before entering.
[]Protect capital first – profit is a by-product of discipline.
📌 SUMMARY & CONCLUSION:
Key Levels:
🔸 Resistance Zone: 55,430 – 55,882
🔸 Profit Booking Zone: 56,106 – 56,256
🔸 Support Levels: 55,116 and 54,719
🔸 Breakout Zone: Above 55,611
🔸 Breakdown Zone: Below 54,719
🔸 NO TRADE ZONE: 55,116 – 55,430
This is a reaction-based market – wait for price to move out of tight consolidation and follow with proper structure. Use pre-marked zones to anticipate market behavior and don’t assume direction without confirmation.
Trade only if the plan aligns with live price action.
⚠️ DISCLAIMER:
I am not a SEBI-registered analyst. This trading plan is shared purely for educational purposes. Please consult your financial advisor before making any investment or trading decisions. Risk management and personal discretion are advised.
Feragatname
Bilgiler ve yayınlar, TradingView tarafından sağlanan veya onaylanan finansal, yatırım, alım satım veya diğer türden tavsiye veya öneriler anlamına gelmez ve teşkil etmez. Kullanım Koşulları bölümünde daha fazlasını okuyun.
Feragatname
Bilgiler ve yayınlar, TradingView tarafından sağlanan veya onaylanan finansal, yatırım, alım satım veya diğer türden tavsiye veya öneriler anlamına gelmez ve teşkil etmez. Kullanım Koşulları bölümünde daha fazlasını okuyun.