Detailed Market Structure Breakdown
4-Hour Chart (Macro Trend)
Structure: The long-term trend is still bullish, but the price has broken below its immediate ascending channel and has entered a corrective phase. The Bank Nifty has retraced nearly to the 38.2% Fibonacci retracement of its recent rally (according to external analysis) and is testing the major demand zone at 54,800 - 55,200.
Key Levels:
Major Supply (Resistance): 55,400 - 55,500. This area is the first major hurdle for bulls to reclaim, aligning with the broken lower channel line.
Major Demand (Support): 54,800 - 55,000. This is the key "line in the sand." A sustained break below 54,800 would signal a deeper correction towards 54,600 and potentially 54,000.
Outlook: The market is at a make-or-break point. A failure to hold 54,800 will accelerate the short-term bearish trend.
1-Hour Chart (Intermediate View)
Structure: The 1H chart shows a clear MSS (Market Structure Shift) to the downside. The price is trading within a descending channel and has broken the 55,200 support zone. It is currently testing the lower end of the corrective channel.
Key Levels:
Immediate Resistance: 55,200. This area now acts as a strong supply zone, aligning with the red box on the chart.
Immediate Support: 54,800. This is the most important level for intraday support.
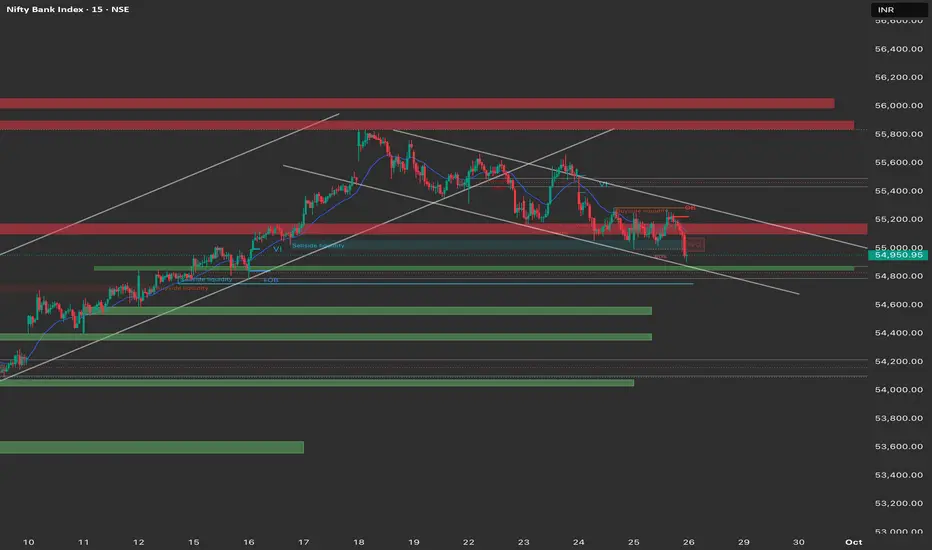
15-Minute Chart (Intraday View)
Structure: The 15M chart shows the Bank Nifty consolidating near its low. The price has recently tested the 54,800 support and is attempting a small bounce, but the overall momentum is still guided by the downtrend channel.
Key Levels:
Intraday Supply: 55,200 (Order Block and consolidation high).
Intraday Demand: 54,800 - 54,900. This zone must hold for any intraday recovery.
Outlook: The intraday bias is bearish. A "sell on rise" approach is favored, targeting a rejection near 55,200.
Trade Plan (Friday, 26th September)
Market Outlook: The Bank Nifty is under short-term bearish pressure but is sitting on strong macro support. The best strategy is to be reactive to the levels.
Bearish Scenario (Primary Plan)
Justification: The market is in a short-term downtrend, and a breakdown of the major 54,800 support will confirm a deeper correction.
Entry: Look for a short entry if the price retests the 55,200 resistance and shows signs of rejection (sell on rise). Alternatively, a decisive break and 15-minute candle close below 54,800.
Stop Loss (SL): Place a stop loss above 55,350 (above the immediate swing high).
Targets:
T1: 54,600 (Next major demand zone).
T2: 54,400 (Extension target).
Bullish Scenario (Counter-Trend/Reversal Plan)
Justification: A strong move back into the previous consolidation range would signal the defense of the macro trend.
Trigger: A sustained move and close above the resistance at 55,300.
Entry: Long entry on a confirmed 15-minute close above 55,300.
Stop Loss (SL): Below 55,100.
Targets:
T1: 55,500 (Upper end of the descending channel).
T2: 55,800 (Major supply zone).
Key Levels for Observation:
Immediate Decision Point: The 54,800 - 55,200 zone.
Bearish Confirmation: A break and sustained move below 54,800.
Bullish Confirmation: A recapture of the 55,300 level.
Line in the Sand: 54,800. The market remains under bearish pressure below this level.
4-Hour Chart (Macro Trend)
Structure: The long-term trend is still bullish, but the price has broken below its immediate ascending channel and has entered a corrective phase. The Bank Nifty has retraced nearly to the 38.2% Fibonacci retracement of its recent rally (according to external analysis) and is testing the major demand zone at 54,800 - 55,200.
Key Levels:
Major Supply (Resistance): 55,400 - 55,500. This area is the first major hurdle for bulls to reclaim, aligning with the broken lower channel line.
Major Demand (Support): 54,800 - 55,000. This is the key "line in the sand." A sustained break below 54,800 would signal a deeper correction towards 54,600 and potentially 54,000.
Outlook: The market is at a make-or-break point. A failure to hold 54,800 will accelerate the short-term bearish trend.
1-Hour Chart (Intermediate View)
Structure: The 1H chart shows a clear MSS (Market Structure Shift) to the downside. The price is trading within a descending channel and has broken the 55,200 support zone. It is currently testing the lower end of the corrective channel.
Key Levels:
Immediate Resistance: 55,200. This area now acts as a strong supply zone, aligning with the red box on the chart.
Immediate Support: 54,800. This is the most important level for intraday support.
15-Minute Chart (Intraday View)
Structure: The 15M chart shows the Bank Nifty consolidating near its low. The price has recently tested the 54,800 support and is attempting a small bounce, but the overall momentum is still guided by the downtrend channel.
Key Levels:
Intraday Supply: 55,200 (Order Block and consolidation high).
Intraday Demand: 54,800 - 54,900. This zone must hold for any intraday recovery.
Outlook: The intraday bias is bearish. A "sell on rise" approach is favored, targeting a rejection near 55,200.
Trade Plan (Friday, 26th September)
Market Outlook: The Bank Nifty is under short-term bearish pressure but is sitting on strong macro support. The best strategy is to be reactive to the levels.
Bearish Scenario (Primary Plan)
Justification: The market is in a short-term downtrend, and a breakdown of the major 54,800 support will confirm a deeper correction.
Entry: Look for a short entry if the price retests the 55,200 resistance and shows signs of rejection (sell on rise). Alternatively, a decisive break and 15-minute candle close below 54,800.
Stop Loss (SL): Place a stop loss above 55,350 (above the immediate swing high).
Targets:
T1: 54,600 (Next major demand zone).
T2: 54,400 (Extension target).
Bullish Scenario (Counter-Trend/Reversal Plan)
Justification: A strong move back into the previous consolidation range would signal the defense of the macro trend.
Trigger: A sustained move and close above the resistance at 55,300.
Entry: Long entry on a confirmed 15-minute close above 55,300.
Stop Loss (SL): Below 55,100.
Targets:
T1: 55,500 (Upper end of the descending channel).
T2: 55,800 (Major supply zone).
Key Levels for Observation:
Immediate Decision Point: The 54,800 - 55,200 zone.
Bearish Confirmation: A break and sustained move below 54,800.
Bullish Confirmation: A recapture of the 55,300 level.
Line in the Sand: 54,800. The market remains under bearish pressure below this level.
Feragatname
Bilgiler ve yayınlar, TradingView tarafından sağlanan veya onaylanan finansal, yatırım, işlem veya diğer türden tavsiye veya tavsiyeler anlamına gelmez ve teşkil etmez. Kullanım Şartları'nda daha fazlasını okuyun.
Feragatname
Bilgiler ve yayınlar, TradingView tarafından sağlanan veya onaylanan finansal, yatırım, işlem veya diğer türden tavsiye veya tavsiyeler anlamına gelmez ve teşkil etmez. Kullanım Şartları'nda daha fazlasını okuyun.