BALAJEE - Descending Triangle Meets Multi-Pattern Confluence
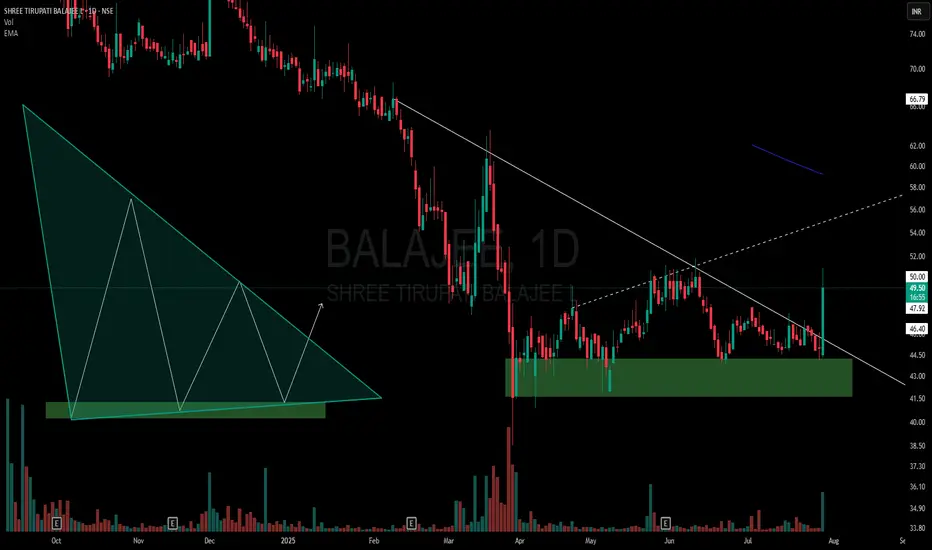
On the daily chart of Balajee, price action has formed a descending triangle right at the lower end of the trend:
🔻 Lower highs consistently pressuring horizontal support.
🟩 Price sitting within a clear demand zone, adding significance to the structure.
📊 Volume tapering off through consolidation, a classic triangle trait.
📐 Presence of a hidden counter-trend line (dotted) hinting at a potential broadening formation — showing a rare multi-pattern overlap.
Such setups are important not for predicting price, but for understanding how multiple structures can interact.
⚠️ Purely educational observation — no buy/sell advice.
🎯 Master My Self-Made Trading Strategy
📈 Telegram (Learn Today): t.me/hashtaghammer
✅ WhatsApp (Learn Today): wa.me/919455664601
📈 Telegram (Learn Today): t.me/hashtaghammer
✅ WhatsApp (Learn Today): wa.me/919455664601
İlgili yayınlar
Feragatname
Bilgiler ve yayınlar, TradingView tarafından sağlanan veya onaylanan finansal, yatırım, işlem veya diğer türden tavsiye veya tavsiyeler anlamına gelmez ve teşkil etmez. Kullanım Şartları'nda daha fazlasını okuyun.