I don`t know if you have seen my preview AXS chart that had more than 500 Likes:

In its recent case against Binance, the SEC introduced 10 cryptocurrencies into the securities classification: BNB (BNB), Binance USD (BUSD), Solana (SOL), Cardano (ADA), Polygon (MATIC), Cosmos (ATOM), The Sandbox (SAND), Decentraland (MANA), Axie Infinity (AXS) and COTI (COTI).
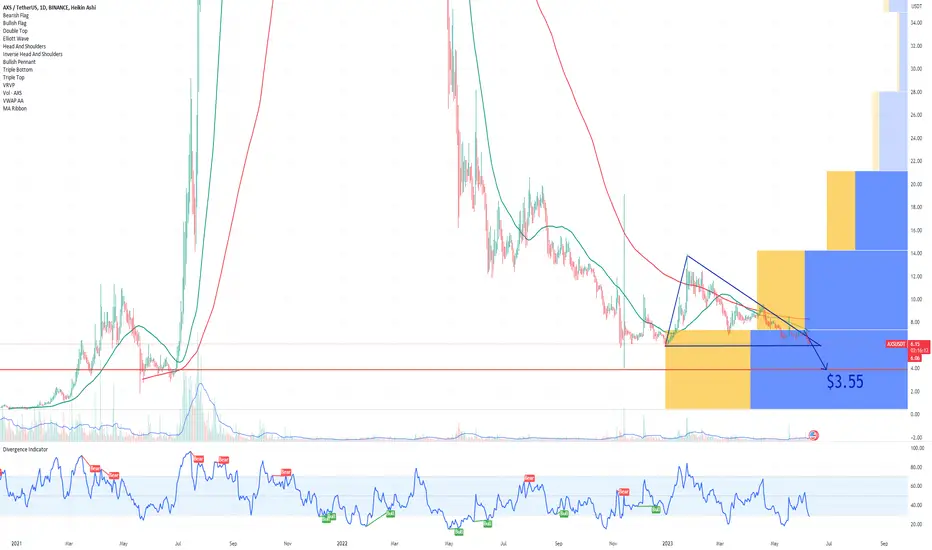
The AXS (Axie Infinity) cryptocurrency recently experienced a breakdown of a triangle formation, signaling a potential bearish pattern. A triangle formation is a common technical chart pattern characterized by converging trendlines, indicating a period of consolidation before an anticipated breakout.
In the case of AXS, the breakdown of the triangle formation suggests a shift in market sentiment towards a bearish bias. This breakdown occurs when the price falls below the lower trendline of the triangle, indicating a potential continuation of the downtrend or a decline in price.
Traders and investors who closely monitor technical patterns may view the breakdown of the AXS triangle formation as a bearish signal, potentially prompting them to consider short positions or adjust their existing trading strategies accordingly.
Considering the above, my prite target for AXS Axie Infinity is $3.55, its strongest support.
Looking forward to read your opinion about it.
In its recent case against Binance, the SEC introduced 10 cryptocurrencies into the securities classification: BNB (BNB), Binance USD (BUSD), Solana (SOL), Cardano (ADA), Polygon (MATIC), Cosmos (ATOM), The Sandbox (SAND), Decentraland (MANA), Axie Infinity (AXS) and COTI (COTI).
The AXS (Axie Infinity) cryptocurrency recently experienced a breakdown of a triangle formation, signaling a potential bearish pattern. A triangle formation is a common technical chart pattern characterized by converging trendlines, indicating a period of consolidation before an anticipated breakout.
In the case of AXS, the breakdown of the triangle formation suggests a shift in market sentiment towards a bearish bias. This breakdown occurs when the price falls below the lower trendline of the triangle, indicating a potential continuation of the downtrend or a decline in price.
Traders and investors who closely monitor technical patterns may view the breakdown of the AXS triangle formation as a bearish signal, potentially prompting them to consider short positions or adjust their existing trading strategies accordingly.
Considering the above, my prite target for AXS Axie Infinity is $3.55, its strongest support.
Looking forward to read your opinion about it.
Private SIGNALS patreon.com/PremiumOptionsSignals
Trading COURSE bit.ly/tradex
RESULTS bit.ly/TG10x
TradeNation bit.ly/t10X
CRYPTO partner.bybit.com/b/37880
BUY-SELL INDICATORS tradingindicators.store/
Trading COURSE bit.ly/tradex
RESULTS bit.ly/TG10x
TradeNation bit.ly/t10X
CRYPTO partner.bybit.com/b/37880
BUY-SELL INDICATORS tradingindicators.store/
İlgili yayınlar
Feragatname
Bilgiler ve yayınlar, TradingView tarafından sağlanan veya onaylanan finansal, yatırım, alım satım veya diğer türden tavsiye veya öneriler anlamına gelmez ve teşkil etmez. Kullanım Koşulları bölümünde daha fazlasını okuyun.