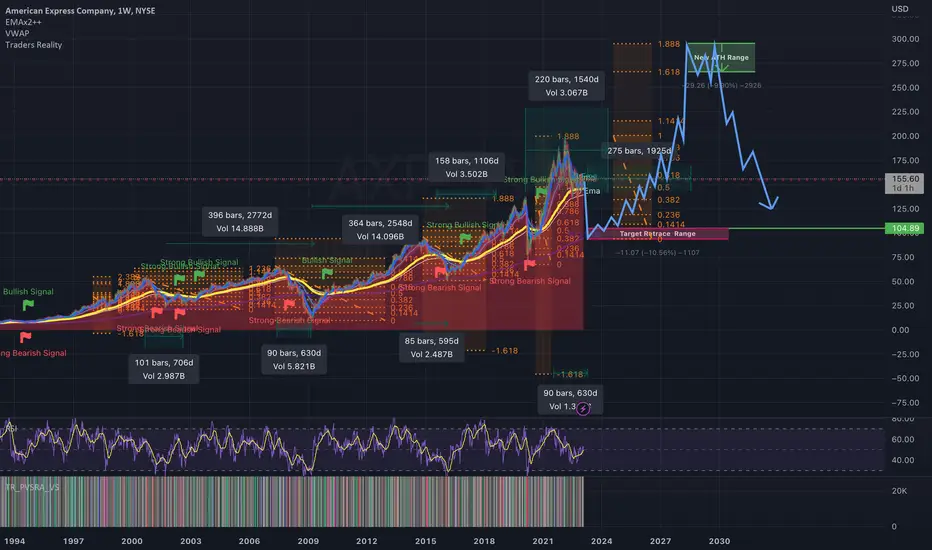
The peaks and valleys of the AXP chart are extremely consistent over time. Every 7 years we see a cycle where we achieve a new ATH and retrace sharply before repeating the cycle. The time ranges in which the elements of this pattern play out are shown. The time it typically takes from peak to low and the time from low to peak. Based on these consistent time and price patterns, this shows my prediction for upcoming cycle low and the following cycle peak. The 7 year cycle is known as the Shamita. It plays a fundamental part in the ebbs and flows of the global financial markets.
Feragatname
Bilgiler ve yayınlar, TradingView tarafından sağlanan veya onaylanan finansal, yatırım, işlem veya diğer türden tavsiye veya tavsiyeler anlamına gelmez ve teşkil etmez. Kullanım Şartları'nda daha fazlasını okuyun.
Feragatname
Bilgiler ve yayınlar, TradingView tarafından sağlanan veya onaylanan finansal, yatırım, işlem veya diğer türden tavsiye veya tavsiyeler anlamına gelmez ve teşkil etmez. Kullanım Şartları'nda daha fazlasını okuyun.