📊 Technical Breakdown – AXISCETF (AXISAMC ETF)
🔍 Key Observations:
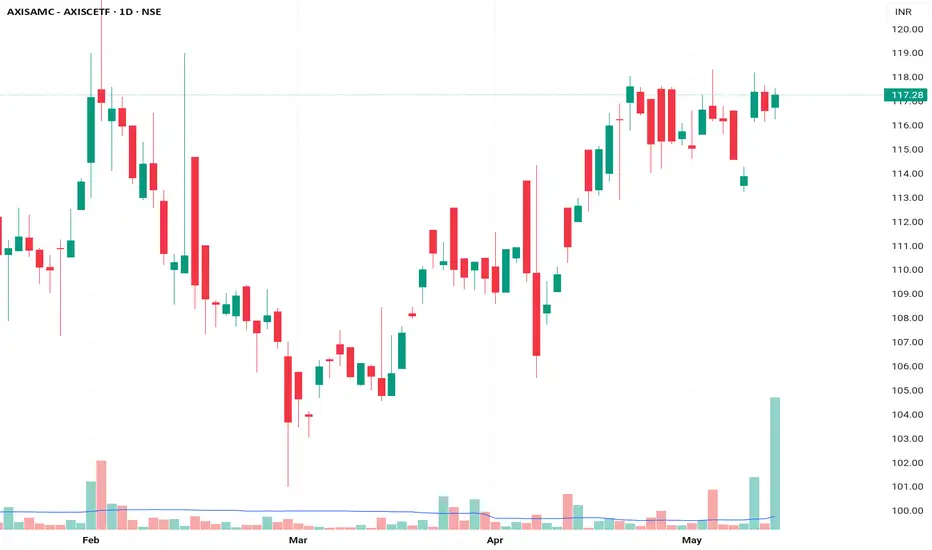
Current Price: ₹117.28
Recent Move: Mild bullish momentum near recent highs.
Volume Spike: Noticeable volume surge on the most recent candle — highest volume in months.
Candle Behavior:
Strong bullish candle 2 sessions ago.
Two small-bodied candles (spinning tops/doji-type), indicating consolidation or indecision.
Indicators on Chart:
Looks like Bollinger Bands (red curves)
Possibly Donchian Channel or support/resistance bands (green lines)
📈 Trend & Structure:
Aspect Observation
Trend Bullish short-term structure (higher highs, higher lows from early April)
Volume Heavy surge — likely accumulation or breakout attempt
Resistance Zone ₹117.50–₹118.00 (recent top range)
Support Zone ₹113.50–₹114.00 (recent breakout candle low)
✅ Stage Classification:
Stage 2 – Early Uptrend Phase
Breakout has occurred already from a sideways base (~₹108–₹114).
Holding above upper Bollinger Band middle line = strength.
Now consolidating just under resistance — likely forming a flag or base for continuation.
🔄 Trading Strategy
📌 Aggressive Entry (if volume remains high):
Buy above ₹118 (fresh breakout).
Stop-loss: ₹114.80 (below tight base).
Target Zones:
₹122–123 (short-term)
₹128+ (medium-term if ETF continues uptrend)
🕵️ Conservative Traders:
Wait for a decisive breakout with volume above ₹118.
Watch for Bollinger Band expansion and closing above resistance.
🧠 Final Summary:
Parameter Status
Trend Bullish
Volume Strong recent surge
Resistance to Watch ₹118
Stage Stage 2 (trend continuation)
Action Plan Buy on breakout with SL at ₹114.8
🔍 Key Observations:
Current Price: ₹117.28
Recent Move: Mild bullish momentum near recent highs.
Volume Spike: Noticeable volume surge on the most recent candle — highest volume in months.
Candle Behavior:
Strong bullish candle 2 sessions ago.
Two small-bodied candles (spinning tops/doji-type), indicating consolidation or indecision.
Indicators on Chart:
Looks like Bollinger Bands (red curves)
Possibly Donchian Channel or support/resistance bands (green lines)
📈 Trend & Structure:
Aspect Observation
Trend Bullish short-term structure (higher highs, higher lows from early April)
Volume Heavy surge — likely accumulation or breakout attempt
Resistance Zone ₹117.50–₹118.00 (recent top range)
Support Zone ₹113.50–₹114.00 (recent breakout candle low)
✅ Stage Classification:
Stage 2 – Early Uptrend Phase
Breakout has occurred already from a sideways base (~₹108–₹114).
Holding above upper Bollinger Band middle line = strength.
Now consolidating just under resistance — likely forming a flag or base for continuation.
🔄 Trading Strategy
📌 Aggressive Entry (if volume remains high):
Buy above ₹118 (fresh breakout).
Stop-loss: ₹114.80 (below tight base).
Target Zones:
₹122–123 (short-term)
₹128+ (medium-term if ETF continues uptrend)
🕵️ Conservative Traders:
Wait for a decisive breakout with volume above ₹118.
Watch for Bollinger Band expansion and closing above resistance.
🧠 Final Summary:
Parameter Status
Trend Bullish
Volume Strong recent surge
Resistance to Watch ₹118
Stage Stage 2 (trend continuation)
Action Plan Buy on breakout with SL at ₹114.8
İlgili yayınlar
Feragatname
Bilgiler ve yayınlar, TradingView tarafından sağlanan veya onaylanan finansal, yatırım, işlem veya diğer türden tavsiye veya tavsiyeler anlamına gelmez ve teşkil etmez. Kullanım Şartları'nda daha fazlasını okuyun.
İlgili yayınlar
Feragatname
Bilgiler ve yayınlar, TradingView tarafından sağlanan veya onaylanan finansal, yatırım, işlem veya diğer türden tavsiye veya tavsiyeler anlamına gelmez ve teşkil etmez. Kullanım Şartları'nda daha fazlasını okuyun.