Price action and chart pattern trading setup
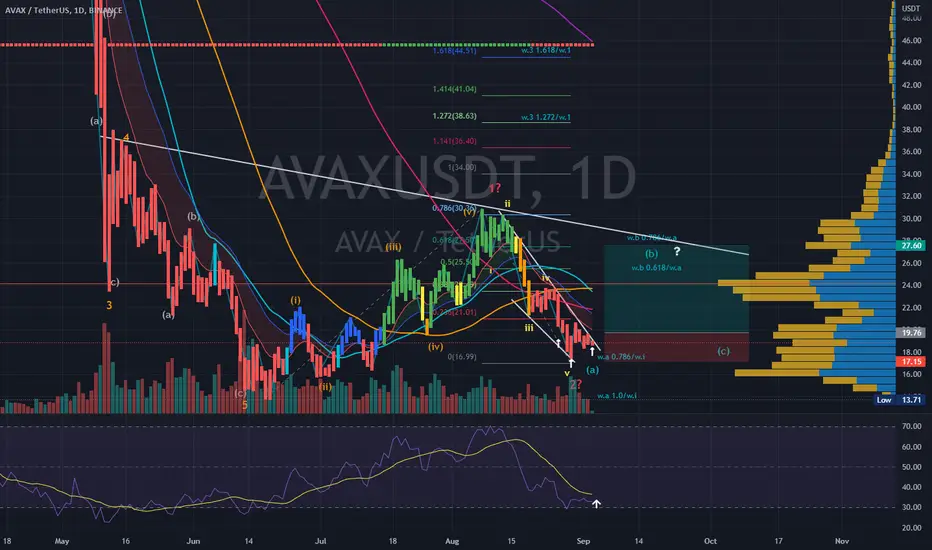
> Elliott Wave analysis possible 2-wave ending diagonal pattern with bullish momentum - a potential falling wedge breakout scenario
> Entry @ 2-wave bullish wedge breakout and EMA10 TF24H
> Target @ upper downtrend line resistance 0.618 - 0.786 retracement of 1-wave zone + 30- 40%
> Stop @ the lowest 2-wave position -10%
> Risk reward ratio: 2:1 / 3:1
Indicator:
>RSI bullish momentum about to cross MA line
>MACD bullish momentum just below signal line
Always trade with affordable risk and respect your stop
Feragatname
Bilgiler ve yayınlar, TradingView tarafından sağlanan veya onaylanan finansal, yatırım, işlem veya diğer türden tavsiye veya tavsiyeler anlamına gelmez ve teşkil etmez. Kullanım Şartları'nda daha fazlasını okuyun.
Feragatname
Bilgiler ve yayınlar, TradingView tarafından sağlanan veya onaylanan finansal, yatırım, işlem veya diğer türden tavsiye veya tavsiyeler anlamına gelmez ve teşkil etmez. Kullanım Şartları'nda daha fazlasını okuyun.