AUDNZD Bullish Setup: Potential Reversal in Progress
Weekly Overview:
Price is holding well at a key weekly support zone, forming a strong rejection candle—indicating buyer interest stepping in at this level.
Daily Chart:
We are seeing consistent bullish pressure with four consecutive bullish candles. This is a good sign that momentum is building on the buy side.
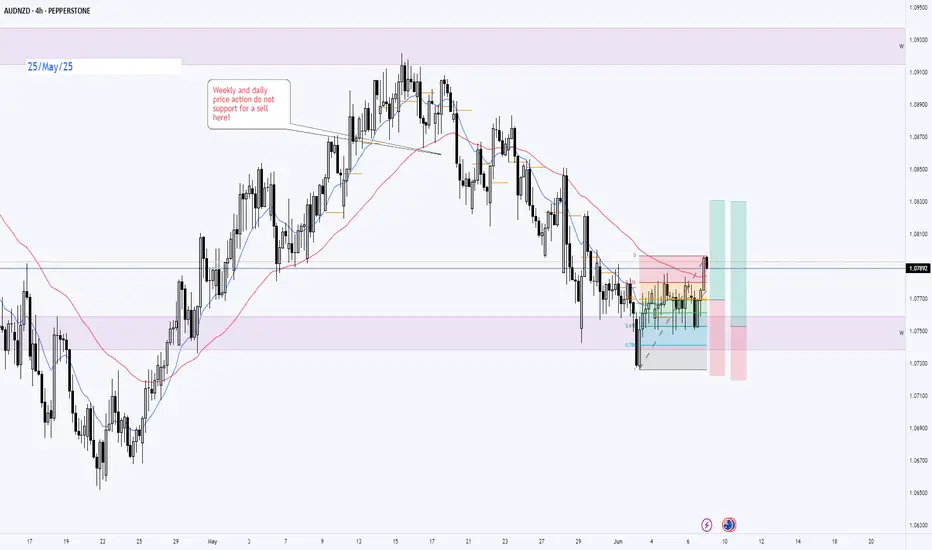
4H Chart:
Price action has decisively broken the downtrend line, pierced above minor resistance levels, and successfully cleared the 50EMA—confirming a potential shift to bullish structure. 📈
Plan:
🔹 Bias: Bullish
🔹 Entry: Wait for retracement to discounted zone or confirmation candle above broken resistance
🔹 Targets:
‣ TP1: Previous 4H high
‣ TP2: Daily resistance zone
🔹 Invalidation: A break back below the 4H 50EMA and trendline support
Price is holding well at a key weekly support zone, forming a strong rejection candle—indicating buyer interest stepping in at this level.
Daily Chart:
We are seeing consistent bullish pressure with four consecutive bullish candles. This is a good sign that momentum is building on the buy side.
4H Chart:
Price action has decisively broken the downtrend line, pierced above minor resistance levels, and successfully cleared the 50EMA—confirming a potential shift to bullish structure. 📈
Plan:
🔹 Bias: Bullish
🔹 Entry: Wait for retracement to discounted zone or confirmation candle above broken resistance
🔹 Targets:
‣ TP1: Previous 4H high
‣ TP2: Daily resistance zone
🔹 Invalidation: A break back below the 4H 50EMA and trendline support
İşlem kapandı: hedefe ulaştı
TPs hitFeragatname
Bilgiler ve yayınlar, TradingView tarafından sağlanan veya onaylanan finansal, yatırım, işlem veya diğer türden tavsiye veya tavsiyeler anlamına gelmez ve teşkil etmez. Kullanım Şartları'nda daha fazlasını okuyun.
Feragatname
Bilgiler ve yayınlar, TradingView tarafından sağlanan veya onaylanan finansal, yatırım, işlem veya diğer türden tavsiye veya tavsiyeler anlamına gelmez ve teşkil etmez. Kullanım Şartları'nda daha fazlasını okuyun.