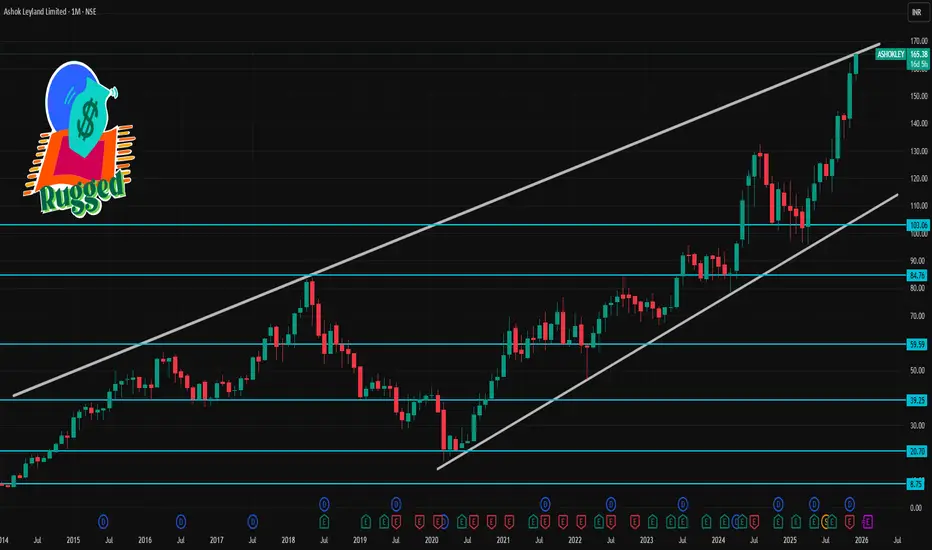
📊 Current Price & Trend (as of latest market close)
Current trading level: ~₹163‑164 on NSE.
Price has rallied strongly and recently hit a 52‑week/all‑time high.
📈 1‑Month Key Levels (Short‑Term Technicals)
🔹 Immediate Resistance (Upside Targets)
R1 ~ ₹165‑167: Short‑term pivot resistance zone.
R2 ~ ₹167‑170: Key near‑term resistance above current.
R3 ~ ₹170‑176: Stronger upside area (if momentum continues).
🔻 Immediate Support (Downside Floors)
S1 ~ ₹161: Nearest short‑term support.
S2 ~ ₹158: Stronger support zone if price tests lower.
S3 ~ ₹156: Major initial support level before deeper pullback.
🧠 What This Means for 1‑Month Outlook
Bullish case (short term):
Holding above ₹158–161 supports continuation.
Clear break above ₹170–176 with strong volume could extend moves toward new highs.
Bearish/Neutral case:
Failure below ₹156–158 puts pressure on short‑term trend.
RSI nearing overbought suggests a possible pullback or consolidation first.
İlgili yayınlar
Feragatname
Bilgiler ve yayınlar, TradingView tarafından sağlanan veya onaylanan finansal, yatırım, alım satım veya diğer türden tavsiye veya öneriler anlamına gelmez ve teşkil etmez. Kullanım Koşulları bölümünde daha fazlasını okuyun.
İlgili yayınlar
Feragatname
Bilgiler ve yayınlar, TradingView tarafından sağlanan veya onaylanan finansal, yatırım, alım satım veya diğer türden tavsiye veya öneriler anlamına gelmez ve teşkil etmez. Kullanım Koşulları bölümünde daha fazlasını okuyun.