Hey team! Quick AMZN update based on the 4-hour chart setup.
📈 Technical Analysis (TA):
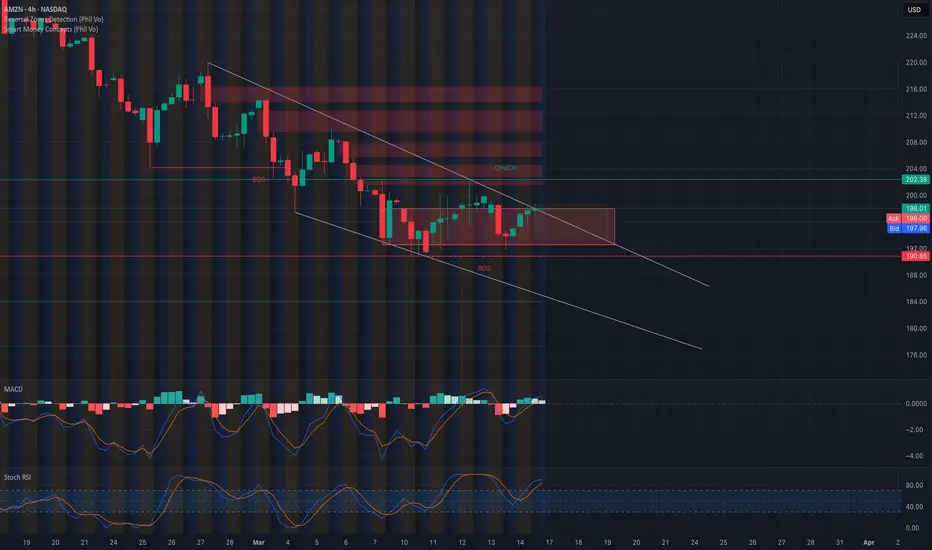
* AMZN is flirting with the top trendline of a descending wedge pattern—could hint at a bullish breakout.
* Crucial resistance zone immediately overhead between $198–$202; breaking this zone could ignite upward momentum.
* Recent BOS (Break of Structure) at $190.85 highlights strong support—this is a key area for bulls.
* Keep an eye on the supply zone around $202.38 if the breakout continues.
📊 GEX & Options Insights:

* Highest positive NET GEX and call resistance at $210; major gamma wall that could act as a price magnet if AMZN breaks higher.
* Strongest PUT support at $190.85; crucial floor level for price.
* IV Rank at 49.6%, indicating moderate volatility and premium—consider debit spreads or strategic premium selling.
* CALL ratio at just 4% signals heavily bearish sentiment in options, implying caution on bullish trades.
💡 Trade Recommendations:
* Bullish Play: A solid break and hold above $202 could set up a bullish run targeting the $210 gamma wall. Stops just below $197.
* Bearish Play: If AMZN rejects firmly at $202, puts targeting a move back down towards $190.85 could offer a solid risk-reward.
* Neutral traders: Iron Condors or credit spreads between clear ranges ($190–$210) could be attractive.
🛑 Risk Management: Stay tight on risk management, especially in a tricky range-bound scenario like this.
Trade smart, everyone!
Disclaimer: This analysis is for educational purposes only and does not constitute financial advice. Always do your own research and manage your risk before trading.
📈 Technical Analysis (TA):
* AMZN is flirting with the top trendline of a descending wedge pattern—could hint at a bullish breakout.
* Crucial resistance zone immediately overhead between $198–$202; breaking this zone could ignite upward momentum.
* Recent BOS (Break of Structure) at $190.85 highlights strong support—this is a key area for bulls.
* Keep an eye on the supply zone around $202.38 if the breakout continues.
📊 GEX & Options Insights:
* Highest positive NET GEX and call resistance at $210; major gamma wall that could act as a price magnet if AMZN breaks higher.
* Strongest PUT support at $190.85; crucial floor level for price.
* IV Rank at 49.6%, indicating moderate volatility and premium—consider debit spreads or strategic premium selling.
* CALL ratio at just 4% signals heavily bearish sentiment in options, implying caution on bullish trades.
💡 Trade Recommendations:
* Bullish Play: A solid break and hold above $202 could set up a bullish run targeting the $210 gamma wall. Stops just below $197.
* Bearish Play: If AMZN rejects firmly at $202, puts targeting a move back down towards $190.85 could offer a solid risk-reward.
* Neutral traders: Iron Condors or credit spreads between clear ranges ($190–$210) could be attractive.
🛑 Risk Management: Stay tight on risk management, especially in a tricky range-bound scenario like this.
Trade smart, everyone!
Disclaimer: This analysis is for educational purposes only and does not constitute financial advice. Always do your own research and manage your risk before trading.
Feragatname
Bilgiler ve yayınlar, TradingView tarafından sağlanan veya onaylanan finansal, yatırım, işlem veya diğer türden tavsiye veya tavsiyeler anlamına gelmez ve teşkil etmez. Kullanım Şartları'nda daha fazlasını okuyun.
Feragatname
Bilgiler ve yayınlar, TradingView tarafından sağlanan veya onaylanan finansal, yatırım, işlem veya diğer türden tavsiye veya tavsiyeler anlamına gelmez ve teşkil etmez. Kullanım Şartları'nda daha fazlasını okuyun.