1. Technical Analysis
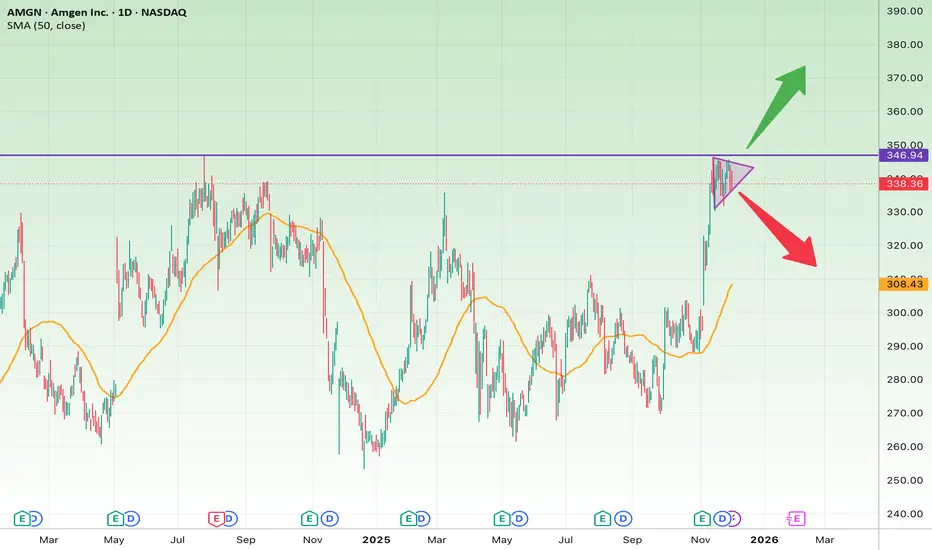
AMGN has formed a bullish pennant pattern after a strong upside rally. This compression typically acts as a continuation setup, suggesting that buyers are preparing for another push higher—if the major resistance gives way.
Key Resistance
• $346.7 → Major multi-year resistance
Bullish Scenario
If AMGN breaks above 346.7:
• Target 1: $360
• Target 2: $370
• Target 3: $385
Bullish catalysts:
• Strong prior momentum
• Bullish Pennant continuation pattern
• Trading well above the 50-day SMA
Bearish Scenario
If price breaks below the pennant support:
• Support 1: $330
• Support 2: $318
• Support 3: 50-day SMA (~$308)
Suggested Stop-Loss
For short-term traders:
• Stop-Loss: A confirmed break below $330
(A close below 330 indicates weakness and invalidation of the pennant.)
For swing/mid-term traders:
• Stop-Loss (safer): $318
(Losing this level breaks the broader bullish structure.)
2. Fundamental Snapshot
Positives
• Strong revenue performance in specialty therapeutics
• Recent earnings beat expectations
• Healthy cash flow and margins
• Expanding R&D pipeline and new partnerships
Risks
• Intense competition within biotech
• Price-pressure risks
• Regulatory and FDA-related uncertainties
Summary:
The fundamentals remain strong and support the bullish technical structure unless major negative catalysts emerge.
3. Final Summary
AMGN is sitting at a critical inflection point.
A breakout above 346.7 could trigger a new bullish leg, while weakness below 330 activates the stop-loss for short-term traders.
Feragatname
Bilgiler ve yayınlar, TradingView tarafından sağlanan veya onaylanan finansal, yatırım, alım satım veya diğer türden tavsiye veya öneriler anlamına gelmez ve teşkil etmez. Kullanım Koşulları bölümünde daha fazlasını okuyun.
Feragatname
Bilgiler ve yayınlar, TradingView tarafından sağlanan veya onaylanan finansal, yatırım, alım satım veya diğer türden tavsiye veya öneriler anlamına gelmez ve teşkil etmez. Kullanım Koşulları bölümünde daha fazlasını okuyun.