🔎 Overview
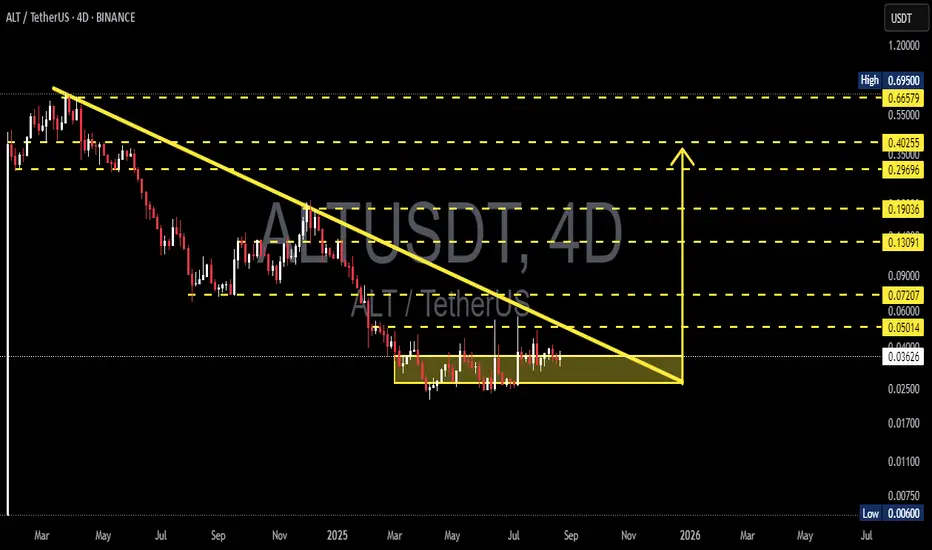
ALT/USDT has been in a prolonged downtrend since 2024, consistently forming lower highs along a descending trendline. At the same time, buyers continue to defend the support base at 0.028–0.031 USDT, creating a clear Descending Triangle pattern.
Currently, price action is consolidating inside a yellow accumulation box — squeezed between strong demand below and heavy supply above. This kind of compression often ends with a large expansion move, either a breakout or a breakdown.
---
🧩 Technical Structure
Main Pattern: Descending Triangle (typically bearish continuation, but at the end of long trends it can act as a reversal).
Key Demand Zone (support): 0.028–0.031
Key Supply Zone (resistance + trendline): 0.040–0.042
Major Resistance Levels:
0.050 → 0.060 → 0.072 → 0.090 → 0.131 → 0.190 → 0.270 → 0.403 → 0.666
Support Levels if Breakdown:
0.017 → 0.011 → 0.006
---
🚀 Bullish Scenario (Potential Reversal & Breakout)
1. Confirmation: 4D close above 0.042 and a clean breakout from the descending trendline.
2. Entry Trigger: Retest of 0.040–0.042 holding as new support.
3. Short- to Mid-Term Targets:
0.050 (minor resistance)
0.060 (psychological barrier)
0.072–0.090 (major supply zone)
4. Long-Term Targets (if momentum builds): 0.130 → 0.190 → 0.270
5. Invalidation: Price closes back below 0.038–0.040 after breakout.
---
📉 Bearish Scenario (Trend Continuation)
1. Confirmation: 4D close below 0.028 with strong volume.
2. Entry Trigger: Retest of 0.028–0.031 fails to reclaim (acting as resistance).
3. Targets to the Downside:
0.017 (historical support)
0.011 (extreme support)
0.006 (all-time low risk zone)
4. Invalidation: Price reclaims above 0.031 after breakdown.
---
⚖️ Key Notes
Price is in a compression phase — the longer it consolidates inside the box, the stronger the eventual breakout or breakdown.
Watch for false breakouts/breakdowns, especially around 0.028–0.042 key levels.
The 4D timeframe provides stronger confirmation signals; patience is key.
Always manage risk: maintain R:R ≥ 1:2, scale in/out across marked levels.
---
🎯 Conclusion
ALT/USDT is at a critical decision point: Will it break out of its long downtrend and start a bullish reversal, or will sellers dominate again and push the price to fresh lows?
The Descending Triangle acts like a “technical time bomb” — pressure keeps building, and once released, it could result in a significant move.
Traders should closely watch for a confirmed breakout above 0.042 (bullish) or a breakdown below 0.028 (bearish) to determine the next major direction.
#ALTUSDT #ALT #Crypto #CryptoAnalysis #PriceAction #DescendingTriangle #Breakout #SupportResistance
✅ Get Free Signals! Join Our Telegram Channel Here: t.me/TheCryptoNuclear
✅ Twitter: twitter.com/crypto_nuclear
✅ Join Bybit : partner.bybit.com/b/nuclearvip
✅ Benefits : Lifetime Trading Fee Discount -50%
✅ Twitter: twitter.com/crypto_nuclear
✅ Join Bybit : partner.bybit.com/b/nuclearvip
✅ Benefits : Lifetime Trading Fee Discount -50%
Feragatname
Bilgiler ve yayınlar, TradingView tarafından sağlanan veya onaylanan finansal, yatırım, işlem veya diğer türden tavsiye veya tavsiyeler anlamına gelmez ve teşkil etmez. Kullanım Şartları'nda daha fazlasını okuyun.