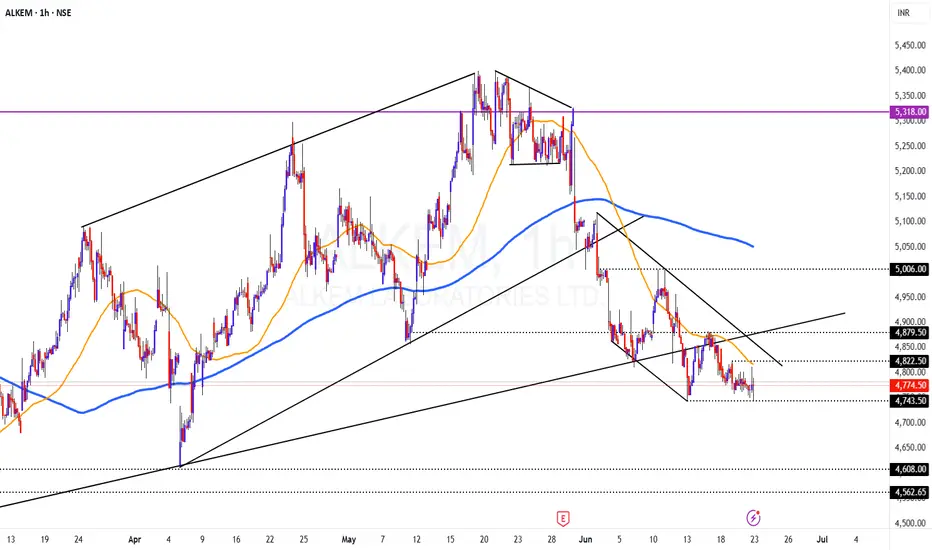
Alkem looks to offer explosive move in the near term.
Levels are marked in the chart.. Price is at around support, but, breakdown usually happens from support levels only.
With a stop above 4825 (hourly close), this looks like a good RR set up.
On Daily TF:
Price is trading below Cloud
Price is trading below all key moving averages
Price had broken and trading below Super Trend Support on Daily and Weekly TF. Monthly SUperTrdend support is placed at 4200 levels only
In P&F chart set up too, it looks like a breakdown. (chart copied below)

Disclaimer: I am not a SEBI registered Analyst and this is not a trading advise. Views are personal and for educational purpose only. Please consult your Financial Advisor for any investment decisions. Please consider my views only to get a different perspective (FOR or AGAINST your views). Please don't trade FNO based on my views. If you like my analysis and learnt something from it, please give a BOOST. Feel free to express your thoughts and questions in the comments section.
Levels are marked in the chart.. Price is at around support, but, breakdown usually happens from support levels only.
With a stop above 4825 (hourly close), this looks like a good RR set up.
On Daily TF:
Price is trading below Cloud
Price is trading below all key moving averages
Price had broken and trading below Super Trend Support on Daily and Weekly TF. Monthly SUperTrdend support is placed at 4200 levels only
In P&F chart set up too, it looks like a breakdown. (chart copied below)
Disclaimer: I am not a SEBI registered Analyst and this is not a trading advise. Views are personal and for educational purpose only. Please consult your Financial Advisor for any investment decisions. Please consider my views only to get a different perspective (FOR or AGAINST your views). Please don't trade FNO based on my views. If you like my analysis and learnt something from it, please give a BOOST. Feel free to express your thoughts and questions in the comments section.
İşlem aktif
Price is now at 4780.. Waiting for it to break and trade below 4730Not
Price has broken 4730 and sustained below... But it looks like a slow grind.. difficult to see/predict Impulse moves as the counter moves are quick and grinding... options are illiquid too.. better to avoid trading this move.. İşlem kapandı: durdurma seviyesi
Price brokeout on the upside... cancelled the trade already..I am not a SEBI Registered Analyst. Views are personal and for Education purpose only. Please consult your Financial Analyst before making investment decision
Feragatname
Bilgiler ve yayınlar, TradingView tarafından sağlanan veya onaylanan finansal, yatırım, işlem veya diğer türden tavsiye veya tavsiyeler anlamına gelmez ve teşkil etmez. Kullanım Şartları'nda daha fazlasını okuyun.
I am not a SEBI Registered Analyst. Views are personal and for Education purpose only. Please consult your Financial Analyst before making investment decision
Feragatname
Bilgiler ve yayınlar, TradingView tarafından sağlanan veya onaylanan finansal, yatırım, işlem veya diğer türden tavsiye veya tavsiyeler anlamına gelmez ve teşkil etmez. Kullanım Şartları'nda daha fazlasını okuyun.