Analysis
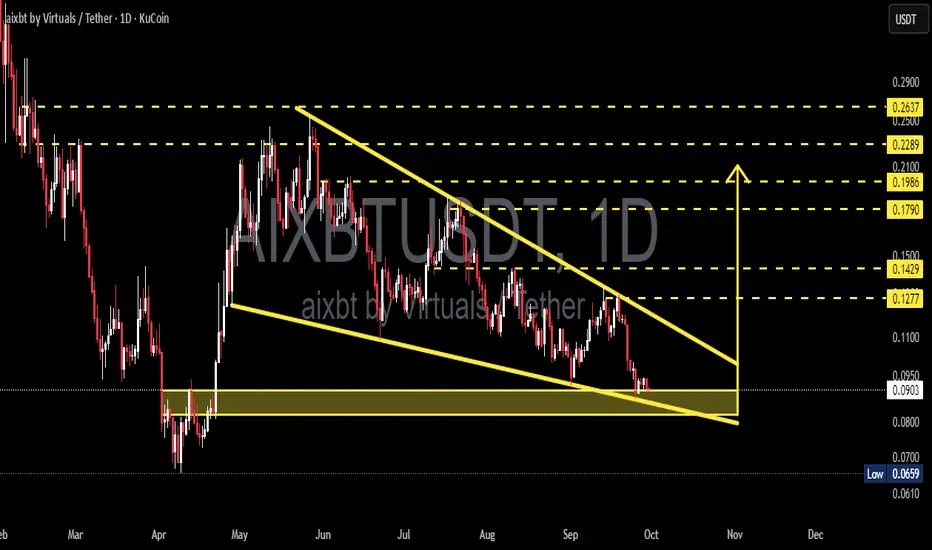
AIXBT/USDT is currently trading within a Falling Wedge pattern on the daily timeframe, a classic setup that often signals a potential bullish reversal if confirmed by an upside breakout.
Right now, price is sitting exactly at the 0.08–0.09 demand zone, a key support area that has held multiple times before. This makes the current level a critical decision point: will we see a strong rebound (bullish reversal) or a breakdown to new lows?
---
Technical Structure
Main Pattern: Falling Wedge → generally bullish once a breakout occurs.
Key Demand Zone: 0.08–0.09 (currently being tested).
Next Major Support if Breakdown: 0.0659 (previous swing low).
Resistance / Upside Targets:
0.1277
0.1429
0.1790
0.1986
0.2289
0.2637
---
Bullish Scenario
Price holds above 0.08–0.09 and forms a reversal candle (hammer, bullish engulfing, pin bar).
Breakout confirmed with a daily close above the wedge trendline + rising volume.
Upside targets: 0.1277 → 0.1429 → 0.1790, with further extension possible toward 0.1986–0.2289.
Example aggressive setup:
Entry ~0.085, Stop ~0.078.
First target 0.1277 → offering R:R above 5, attractive for swing traders.
---
Bearish Scenario
A daily close below 0.08 invalidates the demand zone.
Breakdown opens the path to 0.0659 as the first target.
If that fails, the psychological level around 0.05 becomes the next liquidity zone.
Example short setup (margin traders only): Entry 0.079, Stop 0.088, Target 0.0659 → R:R ~1.4.
---
Falling Wedge Insight
This wedge reflects weakening selling pressure, with lower highs and lower lows converging toward the apex. Often, such setups resolve with a strong move upward, especially after prolonged downtrends. However, traders should beware of false breakouts — confirmation via daily close + volume + successful retest is essential before scaling into larger positions.
---
Strategy & Risk Management
Aggressive: Buy within 0.08–0.09 demand zone with a tight stop below 0.078.
Conservative: Wait for a confirmed breakout above the wedge (~>0.13) and enter on retest.
Risk management: Limit exposure to 1–3% per trade; scale out profits at resistance levels.
Note: Low-cap altcoins can be volatile with wide spreads — use limit orders and watch liquidity closely.
---
Conclusion
AIXBT/USDT is at a critical inflection point. With a falling wedge pattern and price sitting right inside the 0.08–0.09 demand zone, the market is preparing for a decisive move.
If support holds: strong chance of reversal toward higher resistances.
If support breaks: expect deeper correction to 0.0659 or lower.
In short, AIXBT is not in ordinary sideways action — it’s at a crossroads where the next move could define its medium-term trend.
---
#AIXBT #AIXBTUSDT #Crypto #Altcoin #TechnicalAnalysis #FallingWedge #Support #Breakout #BullishScenario #BearishScenario #RiskManagement
✅ Get Free Signals! Join Our Telegram Channel Here: t.me/TheCryptoNuclear
✅ Twitter: twitter.com/crypto_nuclear
✅ Join Bybit : partner.bybit.com/b/nuclearvip
✅ Benefits : Lifetime Trading Fee Discount -50%
✅ Twitter: twitter.com/crypto_nuclear
✅ Join Bybit : partner.bybit.com/b/nuclearvip
✅ Benefits : Lifetime Trading Fee Discount -50%
Feragatname
Bilgiler ve yayınlar, TradingView tarafından sağlanan veya onaylanan finansal, yatırım, işlem veya diğer türden tavsiye veya tavsiyeler anlamına gelmez ve teşkil etmez. Kullanım Şartları'nda daha fazlasını okuyun.