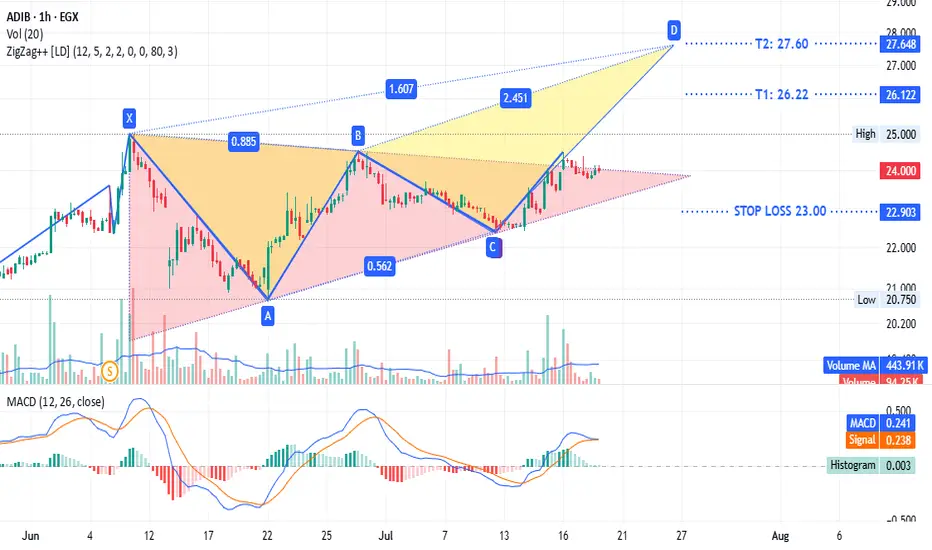
Is showing a triangle pattern with a potential bearish trend. It is currently testing the upper line of the triangle. The stop loss is at 23.00, and the target sell point ranges from 26.22 to 27.60.
This is not investment advice, only my analysis based on the chart data. Consult your account manager before making any investment decisions. Good luck.
İşlem aktif
retest the triangle pattern i think it is an opportunity to open long position by low risk
This is not investment advice, only my analysis based on the chart data. Consult your account manager before making any investment decisions. Good luck.
Feragatname
Bilgiler ve yayınlar, TradingView tarafından sağlanan veya onaylanan finansal, yatırım, alım satım veya diğer türden tavsiye veya öneriler anlamına gelmez ve teşkil etmez. Kullanım Koşulları bölümünde daha fazlasını okuyun.
Feragatname
Bilgiler ve yayınlar, TradingView tarafından sağlanan veya onaylanan finansal, yatırım, alım satım veya diğer türden tavsiye veya öneriler anlamına gelmez ve teşkil etmez. Kullanım Koşulları bölümünde daha fazlasını okuyun.